
About the Fibonacci Candles Indicator
The Fibonacci Candles Indicator for MT5 is a trend-focused tool that uses Fibonacci analysis to generate buy and sell signals directly on the chart.
By plotting colored candlesticks, it visually highlights potential trade opportunities in an easy-to-read format.
A teal candlestick signals a potential buy trade, while a magenta candlestick signals a potential sell trade.
Trades can be closed or reversed when an opposite colored candlestick appears, helping traders follow trend shifts efficiently.
Traders can adjust input settings to refine sensitivity and match their preferred trading style.
Free Download
Key Features
- Plots buy and sell trend candlesticks using Fibonacci analysis.
- Teal candlesticks indicate buy signals; magenta candlesticks indicate sell signals.
- Non-repainting for reliable trade decisions.
- Can be used standalone or alongside other strategies.
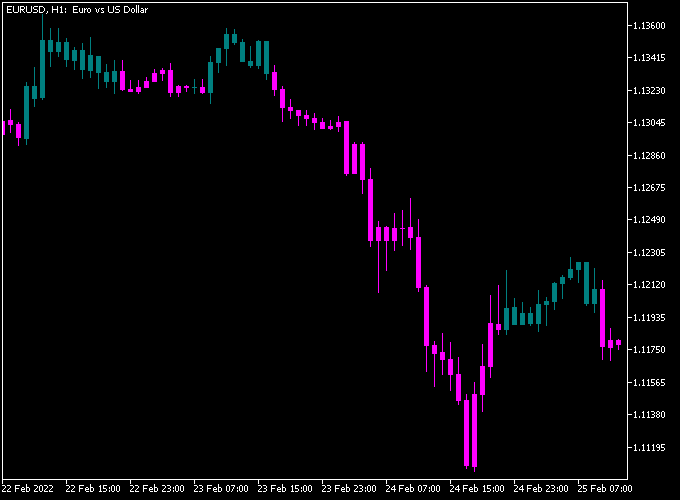
Indicator Chart
The Fibonacci Candles Indicator displays colored candlesticks directly on the main chart.
Teal candlesticks signal bullish momentum and potential buy trades, while magenta candlesticks signal bearish momentum and potential sell trades.
The chart demonstrates how traders can identify trend shifts and reversals at a glance.
Guide to Trade with the Fibonacci Candles Indicator
Buy Rules
- Wait for the first teal candlestick to appear on the chart.
- Confirm that the overall trend supports a bullish move.
- Check that momentum and price action align with the signal.
- Open a buy trade once the conditions are validated.
Sell Rules
- Wait for the first magenta candlestick to appear on the chart.
- Confirm that the overall trend supports a bearish move.
- Check that momentum and price action align with the signal.
- Open a sell trade once the conditions are validated.
Stop Loss
- Place stop losses slightly below the low of the teal candlestick for buy trades.
- Place stop losses slightly above the high of the magenta candlestick for sell trades.
- Optionally use the previous swing low or high for an additional buffer.
Take Profit
- Close buy trades if a magenta candlestick appears or momentum weakens.
- Close sell trades if a teal candlestick appears or momentum weakens.
- Optionally target previous swing highs for buys or swing lows for sells.
- Consider trailing profits to capture extended trend moves.
Download Now
FAQ
How does the Fibonacci Candles Indicator signal trades?
The indicator uses colored candlesticks to signal potential trades.
Teal candlesticks indicate bullish conditions for buying, while magenta candlesticks indicate bearish conditions for selling.
Can the indicator be used on all timeframes?
Yes. It works across multiple timeframes and is suitable for scalping, intraday, and swing trading.
Does the indicator repaint?
No. Once a candlestick signal appears, it remains fixed, providing reliable guidance for trade entries and exits.
Is the indicator suitable for beginners?
Yes. Its visual candlestick signals make it easy to interpret trends and trade decisions without advanced analysis.
Summary
The Fibonacci Candles Indicator is a versatile tool that transforms Fibonacci analysis into clear, actionable candlestick signals.
Teal and magenta candlesticks highlight potential buy and sell trades, helping traders follow trend shifts with confidence.
Combined with proper stop loss and take profit strategies, it provides an effective approach for capturing trend-based opportunities across multiple currency pairs and timeframes.


