About the Flat Trend Indicator
The Flat Trend Indicator for MT4 is a reliable trend-following tool that helps traders identify market direction and make informed trading decisions.
It uses colored histogram bars in a separate window to indicate bullish, bearish, or neutral market conditions.
The indicator shows green bars for upward trends, red bars for downward trends, and yellow bars for sideways or flat market phases.
This makes it easier to spot emerging trends and avoid trades during low volatility periods.
Designed for both beginners and experienced traders, Flat Trend is a no-repaint, ensuring signals remain fixed once displayed.
Free Download
Download the “Flat_Trend.mq4” indicator for MT4
Key Features
- No-repaint trend-following indicator
- Green bars indicate upward trends for buy signals
- Red bars indicate downward trends for sell signals
- Yellow bars indicate neutral or flat markets
- Provides clear trend visualization for all currency pairs
- Effective on multiple timeframes for intraday and swing trading
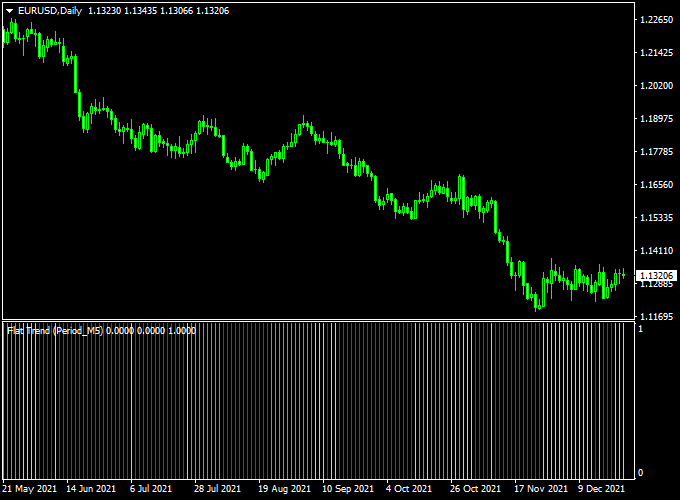
Indicator Chart
The chart displays a histogram showing trend direction.
Green bars highlight bullish momentum, red bars highlight bearish momentum, and yellow bars show periods of low volatility.
Traders can use these bars to identify potential entry points and avoid choppy markets.

Guide to Trade with Flat Trend Indicator
Buy Rules
- Open a buy trade when the first green bar appears after a flat or downward phase.
- Check that momentum is sustained by observing subsequent bars.
- Optional: Confirm trend direction with a moving average or support/resistance levels.
Sell Rules
- Open a sell trade when the first red bar appears after a flat or upward phase.
- Observe the following bars to ensure the trend is continuing.
- Optional: Combine with trend filters to avoid false breakouts.
Stop Loss Placement
- Buy trades: just below the green signal bar start, or near support.
- Sell trades: just above the red signal bar, or start or near resistance.
- Optional: use ATR or a small percentage of the entry price for dynamic stops.
Take Profit Targets
- Take profits near previous support/resistance levels or pivot points.
- Partial exits can be taken when histogram bars start showing yellow, indicating consolidation.
- Trailing stops can lock in gains as the trend continues.
Practical Trading Tips
- Focus on high-volume sessions for more reliable trends.
- Combine with oscillators or momentum indicators for trend confirmation.
- Use the yellow bars to identify flat or ranging markets and avoid unnecessary trades.
- Adjust histogram colors and thickness for better chart clarity.
Flat Trend + Magic Trend MT4 Forex Strategy
This MT4 trading strategy combines the Flat Trend Indicator and the Magic Trend Indicator to create a powerful confirmation system for intraday trading.
The Flat Trend Indicator highlights the prevailing momentum with histogram bars, while the Magic Trend Indicator plots color-coded lines that show immediate trend changes.
Using both tools together helps traders enter trades with higher probability and tighter stops.
It works best on 5-minute, 15-minute, and 30-minute charts during active London or New York sessions.
Buy Entry Rules
- Wait until the Flat Trend Indicator shows a green histogram bar above the zero level (bullish momentum).
- Confirm that the Magic Trend line has turned green at the close of the candle.
- Enter a buy trade at the close of that candle.
- Place a stop loss a few pips below the most recent swing low.
- Set take profit at least a 2:1 risk-reward ratio or near the next resistance level.
Sell Entry Rules
- Wait until the Flat Trend Indicator shows a red histogram bar below the zero level (bearish momentum).
- Confirm that the Magic Trend line has turned red at the close of the candle.
- Enter a sell trade at the close of that candle.
- Place a stop loss a few pips above the most recent swing high.
- Set take profit at least a 2:1 risk-reward ratio or near the next support level.
Advantages
- Combines momentum (Flat Trend) with clear visual trend changes (Magic Trend) for stronger signals.
- Good for intraday scalping on lower timeframes (5M, 15M, 30M).
- Clear and easy visual cues reduce decision stress.
- Allows traders to use tight stops and fixed risk levels.
Drawbacks
- Signals can lag during extremely volatile spikes.
- Not ideal in very flat or low-volume markets.
- Requires active monitoring during high-impact news events.
Case Study 1: EUR/USD 15-Minute Chart
During the London session, the Flat Trend Indicator printed a green histogram bar, and the Magic Trend line turned green near 1.0950.
A buy was entered at 1.0952.
The swing low was at 1.0940, so the stop loss was placed at 1.0938 (14 pips risk).
The target was set at 2:1 (28 pips), giving a take profit of 1.0980.
Price rose steadily and hit the target, producing a gain of 28 pips.
Case Study 2: GBP/USD 5-Minute Chart
In the New York session, the Flat Trend Indicator showed a red histogram bar, and the Magic Trend line turned red near 1.3070.
A sell order was placed at 1.3068.
The swing high was at 1.3080, so the stop loss was at 1.3082 (14 pips risk).
The target was set to 2:1 (28 pips), giving a TP of 1.3040.
Price dropped quickly and reached the target, netting 28 pips profit.
Strategy Tips
- Trade during major sessions for more reliable moves.
- Always wait for both indicators to align before entering.
- Use fixed risk percentages per trade to protect capital.
- Combine with higher timeframe support/resistance for extra confirmation.
Download Now
Download the “Flat_Trend.mq4” indicator for Metatrader 4
FAQ
Does Flat Trend repaint its signals?
No. Once a histogram bar is displayed, it remains fixed, giving traders confidence in the signal.
Can it be used alone or with other indicators?
It can be used standalone to identify trend direction, but combining with support/resistance or moving averages can improve trade accuracy.
How can I avoid trading during flat markets?
Pay attention to yellow bars, which indicate sideways or low-volatility periods. Avoid opening trades during these phases to reduce false signals.
Summary
The Flat Trend Indicator for MT4 is a straightforward and effective trend-following tool that uses colored histogram bars to show market direction.
Green bars signal upward trends, red bars indicate downward trends, and yellow bars warn of flat conditions, helping traders choose high-probability trades.
Its no-repaint design ensures reliable signals, making it suitable for both beginners and experienced traders.
When combined with trend confirmation tools or support/resistance levels, Flat Trend becomes a powerful indicator for capturing strong trends and avoiding choppy markets.


