
About the Forex Market Statistics Indicator
The Forex Market Statistics indicator is a free MT4 tool that helps traders analyze how price behaves around key market areas.
Instead of relying solely on traditional trend indicators, this tool focuses on statistical price behavior.
It enables traders to identify zones where the market tends to pause, build pressure, or change direction.
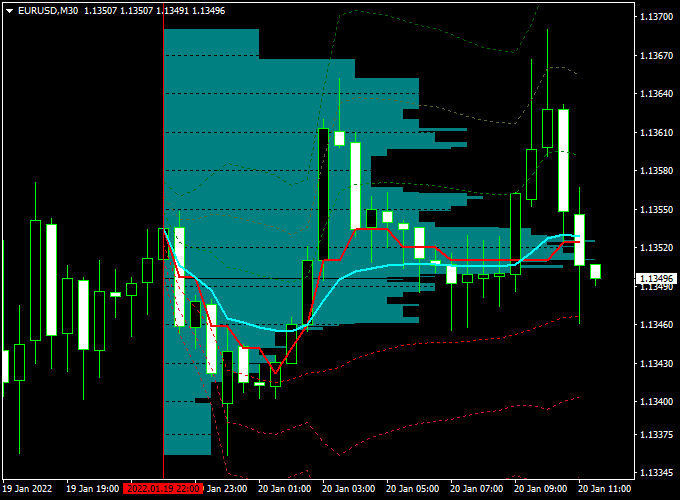
The indicator appears directly in the main MT4 chart window as an array of aqua colored horizontal lines.
These lines represent statistical market zones where price has shown repeated activity.
Traders can use these levels to identify accumulation near support, distribution near resistance, and potential breakout or reversal areas.
This makes the Forex Market Statistics indicator useful for both trade entries and exits, as well as for filtering low-quality setups.
Free Download
Download the “Market statistics.mq4” indicator for MT4
Key Features
- Displays statistical price levels directly on the MT4 chart.
- Highlights areas of price accumulation and distribution.
- Uses aqua colored lines for easy recognition.
- Works on all currency pairs and time frames.
- Suitable for trend, range, and breakout trading.
- Can be combined with price action or other indicators.
Indicator Chart
The Forex Market Statistics indicator chart displays aqua-colored horizontal lines across the price chart.
These lines highlight zones where price has repeatedly interacted, helping traders identify potential support and resistance areas for trade decisions.
Guide to Trade with Forex Market Statistics Indicator
Buy Rules
- Check the Market Statistics indicator for areas showing price accumulation near support zones.
- Wait for the price to slow down or stabilize around the aqua colored level.
- Enter a buy trade when bullish price behavior starts to appear.
Sell Rules
- Look for price action near resistance areas highlighted by the Market Statistics indicator.
- Observe signs of price rejection or slowing momentum near the aqua colored level.
- Enter a sell trade once bearish price behavior becomes visible.
Stop Loss
- Place the stop loss beyond the next Market Statistics level.
- For buy trades, set the stop below the support zone.
- For sell trades, set the stop above the resistance zone.
Take Profit
- Target the next opposing Market Statistics level.
- Secure partial profits when the price reacts at intermediate zones.
- Let profits run if the price breaks through a statistical level with strength.
Practical Tips
- Combine with candlestick patterns for better entry timing.
- Avoid trading during very low liquidity periods.
- Use the indicator as a filter to avoid chasing price.
MT4 Market Statistics and SuperTrend MTF Forex Strategy
The MT4 Market Statistics and SuperTrend MTF Forex Strategy is designed for traders who want to combine statistical market data with dynamic trend confirmation.
It merges the analytical power of the Forex Market Statistics Indicator with the trend-following accuracy of the SuperTrend MTF Forex Signal Indicator.
This combination helps traders understand market structure, volatility, and session behavior, while timing entries precisely when trend direction changes.
The Market Statistics indicator displays valuable data directly on the chart, similar to the Market Profile concept.
It highlights areas where the price has spent significant time and volume, helping traders identify potential support and resistance zones.
Meanwhile, the SuperTrend MTF indicator confirms the current market direction using a simple color system: a green line for bullish trends and a red line for bearish ones.
When both indicators align, traders can enter trades backed by statistical context and momentum confirmation.
This strategy works best on the M5 and M15 timeframes for intraday setups.
It’s ideal for traders who prefer short- to medium-term movements with clearly defined entries and exits.
The method suits all major currency pairs and gold, particularly during the London and New York trading sessions.
Buy Entry Rules
- Check the Market Statistics indicator for areas showing price accumulation near support zones.
- Wait for the SuperTrend MTF line to change from red to green, confirming a bullish shift.
- Enter a buy trade once the candle closes fully above the green SuperTrend line.
- Set a stop loss just below the nearest support or Market Statistics low area.
- Take profit at the next resistance or when the SuperTrend line turns red again.
Sell Entry Rules
- Look for price action near resistance areas highlighted by the Market Statistics indicator.
- Wait for the SuperTrend MTF line to change from green to red, signaling a bearish transition.
- Enter a sell trade after the candle closes below the red SuperTrend line.
- Set a stop loss just above the nearest resistance or Market Statistics high zone.
- Take profit at the next support or when the SuperTrend line turns green again.
Advantages
- Combines statistical data and trend confirmation for high-confidence trades.
- Provides clear visual guidance directly on the chart.
- Reduces emotional decision-making by relying on factual market behavior.
- Can be used across multiple timeframes for flexible trading.
- Ideal for short-term trend followers and day traders.
Drawbacks
- Whipsaws may occur during ranging markets.
- Requires monitoring of session volatility for accurate results.
- SuperTrend MTF may lag slightly during sharp reversals.
- Performance depends on the correct interpretation of the statistical zones.
Case Study 1: EUR/USD M5
On the EUR/USD M5 chart during the London session, the Market Statistics indicator highlighted a strong accumulation zone around 1.0860.
After a brief retracement, the SuperTrend MTF line turned green at 1.0868, confirming bullish momentum.
A buy trade was placed with a stop loss at 1.0852 and a target near 1.0898.
The trade moved smoothly upward, hitting the target for a +30 pip gain within 40 minutes.
The statistical data correctly identified the low-risk zone, while the SuperTrend line confirmed entry timing.
Case Study 2: GBP/USD M15
During the New York session, the Market Statistics indicator displayed heavy price concentration around 1.2605.
The price tested this area several times before breaking lower.
The SuperTrend MTF line turned red at 1.2598, confirming a bearish trend continuation.
A sell trade was taken with a stop loss at 1.2615 and a take profit at 1.2560.
The pair declined steadily, hitting the target after one and a half hours, resulting in a +38 pip profit.
The combination of market data and trend confirmation allowed for a confident entry aligned with the session’s momentum.
Strategy Tips
- Focus on London and New York hours when market activity is strongest.
- Avoid trading during low volatility periods, such as the Asian session close.
- Use the Market Statistics zones as reference points for support and resistance rather than exact levels.
- Confirm the SuperTrend color change with a strong candle close to avoid false signals.
- For better accuracy, consider aligning the M15 SuperTrend direction when trading on M5.
- Use partial profit-taking at nearby levels before aiming for full targets to secure gains.
Download Now
Download the “Market statistics.mq4” indicator for Metatrader 4
FAQ
What does the Forex Market Statistics indicator measure?
It analyzes statistical price behavior to highlight zones where the market has spent significant time trading.
Is this indicator suitable for range trading?
Yes. It works well in ranging markets by highlighting accumulation near support and distribution near resistance.
Can it be used together with trend indicators?
Yes. Many traders use it alongside moving averages or trend filters to improve trade selection.
Do the statistical levels change over time?
Levels update as new market data forms, but once plotted they do not repaint past values.
Summary
The Forex Market Statistics MT4 indicator provides traders with valuable insight into how the price behaves around statistically important zones.
By displaying aqua colored levels directly on the chart, it helps identify areas where price may accumulate, stall, or reverse.
This indicator is flexible and works across all currency pairs and time frames.
It can be used for entries, exits, or as a supporting tool within a broader trading strategy.
With disciplined risk management and proper confirmation, the Forex Market Statistics indicator can help traders improve timing and make more informed trading decisions.


