About the Price Heatmap Version 1.05 Indicator
The Forex Price Heatmap V1.05 Indicator for MT5 creates a visual heatmap overlay on your price chart, highlighting areas of bullish and bearish trend strength.
It allows traders to gauge the overall market direction and identify high-probability entry and exit zones.
An upward-sloping heatmap signals a bullish trend, while a downward-sloping heatmap indicates bearish conditions.
This intuitive visualization helps traders anticipate price reactions at key support and resistance areas and make more informed trading decisions.
The indicator is highly customizable, with settings for histogram timeframe, period, range, display bars, and colors.
It works across multiple timeframes and currency pairs.
Free Download
price_heatmap_v1.05.mq5 Indicator (MT5)
Key Features
- Displays a heatmap to indicate bullish or bearish trend direction.
- Upward-sloping heatmap signals a potential buy opportunity.
- Downward-sloping heatmap signals a potential sell opportunity.
- Customizable histogram timeframe, period, and range.
- Adjustable color schemes for better chart visibility.
- Helps identify trade entry points and take profit zones.
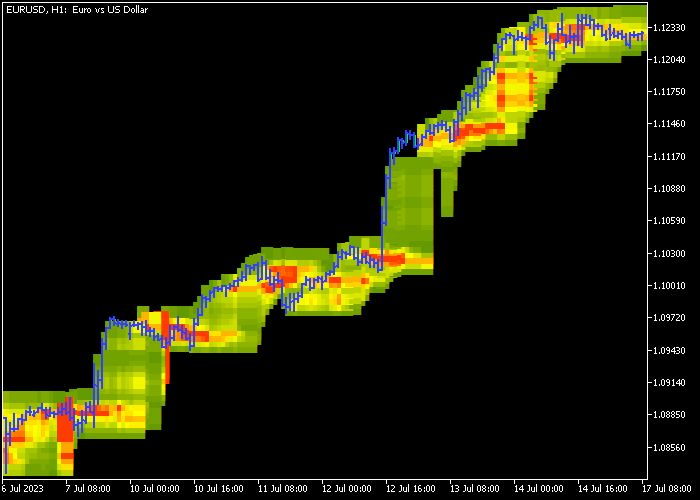
Indicator Chart
The Forex Price Heatmap V1.05 Indicator overlays a color-coded trend map on the price chart, clearly showing bullish and bearish pressure.
Traders can see when price interacts with the upper or lower regions of the heatmap.
Buy opportunities arise when price touches the lower part of an upward-sloping heatmap.
Sell opportunities arise when price touches the upper part of a downward-sloping heatmap.
This makes it easier to enter trades in the direction of the prevailing trend.
Guide to Trade with Forex Price Heatmap V1.05 Indicator
Buy Rules
- Ensure the heatmap is trending upward, indicating bullish momentum.
- Wait for the price to touch the lower region of the heatmap.
- Open a buy trade at that level.
- Confirm the trend with price action before entering.
Sell Rules
- Ensure the heatmap is trending downward, indicating bearish momentum.
- Wait for the price to touch the upper region of the heatmap.
- Open a sell trade at that level.
- Confirm the trend with price action before entering.
Stop Loss
- For buy trades, place the stop loss just below the lower channel of the heatmap.
- For sell trades, place the stop loss just above the upper channel of the heatmap.
- Adjust stop levels according to the width of the heatmap channel and current market volatility.
Take Profits
- For buy trades, exit when the candlestick touches the upper part of the heatmap.
- For sell trades, exit when the candlestick touches the lower part of the heatmap.
- Alternatively, set a fixed pip target that aligns with your strategy.
- Consider trailing profits while the heatmap trend remains strong.
Forex Price Heatmap and ATR Adaptive SMA MT5 Trend Strategy
This trend strategy combines overall market direction with precise entry timing to capture high-probability trades.
It uses the Forex Price Heatmap Version 1.05 Indicator for MT5 to determine the market trend, alongside the ATR Adaptive SMA Indicator for MT5 for entry signals.
The Forex Price Heatmap visually highlights market strength and direction.
When the heatmap trends upward, the market is bullish; when it trends downward, the market is bearish.
This provides a clear, at-a-glance trend filter for trading decisions.
The ATR Adaptive SMA indicator adapts to market volatility and provides signal lines for entry timing.
Combining these two indicators allows traders to follow the trend while entering on precise momentum shifts.
This strategy works well on M15 and H1 charts and is suitable for major currency pairs and liquid commodities.
It emphasizes trading with the trend while avoiding counter-trend entries.
Buy Entry Rules
- Confirm that the Forex Price Heatmap is trending upward, indicating a bullish market environment.
- Wait for the ATR Adaptive SMA signal line to turn green, showing a buy entry opportunity.
- Enter a buy trade at the open of the next candle after the green signal is confirmed.
- Place the stop loss below the recent swing low or below the ATR-based support level.
- Take profit near the next resistance or when the ATR Adaptive SMA signal line switches to pink.
Sell Entry Rules
- Confirm that the Forex Price Heatmap is trending downward, showing bearish conditions.
- Wait for the ATR Adaptive SMA signal line to turn pink, indicating a sell entry.
- Enter a sell trade at the opening of the next candle after the pink signal appears.
- Set the stop loss above the recent swing high or above the ATR-based resistance level.
- Exit the trade when the ATR Adaptive SMA signal line turns green or the heatmap reverses upward.
Case Study 1: GBP/USD M15 Trend Continuation
During the London session, GBP/USD was trending upward according to the heatmap.
A green ATR Adaptive SMA signal line appeared after a minor pullback, indicating a buy entry.
The trade was opened at the next candle, with a stop loss placed below the recent swing low.
Price continued higher, and the trade reached its target near resistance, gaining 20 pips.
Case Study 2: AUD/JPY H1 Trend Reversal
On the H1 chart, AUD/JPY was showing a downward trend on the heatmap.
After a brief retracement, the ATR Adaptive SMA turned pink, signaling a sell entry.
A short trade was executed with a stop loss above the recent swing high.
Price moved steadily downward, and the position was closed as the ATR signal turned green, capturing 37 pips..
Download Now
price_heatmap_v1.05.mq5 Indicator (MT5)
FAQ
How does the heatmap indicate trend strength?
The slope of the heatmap shows the direction of market momentum.
A steeper upward slope indicates stronger bullish pressure, while a steeper downward slope indicates stronger bearish pressure.
Can I customize the heatmap appearance?
Yes. You can modify the histogram timeframe, period, range, bar display, and colors to match your chart preferences and improve signal visibility.
Which timeframes are ideal for this indicator?
The heatmap can be applied to any timeframe.
Scalpers often prefer M5 or M15, while intraday and swing traders may use H1 or H4 for broader trend context.
Summary
The Forex Price Heatmap V1.05 Indicator visually represents trend direction and strength, allowing traders to enter and exit trades at optimal points.
Upward and downward slopes make bullish and bearish setups easier to identify.
Its customizable settings and compatibility across timeframes make it a flexible tool for scalpers, day traders, and swing traders.
By combining heatmap trends with price action, traders can improve timing, reduce risk, and achieve more structured trading decisions.