About the Forex Strategy Indicator
The Forex Strategy Indicator for MT4 is a complete, ready-to-use trading system that simplifies decision-making for traders.
It transforms a full trading strategy into intuitive buy and sell arrows, making it easy to identify high-probability trade opportunities.
The indicator includes a mini dashboard that displays essential trade information at a glance.
The indicator appears in the main Metatrader 4 chart window as colored arrows: blue for buy signals and red for sell signals.
The mini dashboard shows trade direction, helping traders monitor signals without cluttering the chart.
This combination makes the Forex Strategy Indicator suitable for both beginners and experienced traders seeking a practical, actionable strategy.
Free Download
Download the “forex-strategy-indicator.mq4” indicator for MT4
Key Features
- Complete buy and sell trading strategy integrated into MT4
- Blue arrows indicate buy trades
- Red arrows indicate sell trades
- Mini dashboard shows trade direction and status
- Plotted directly on the main chart for easy interpretation
- Ready-to-use, out-of-the-box setup
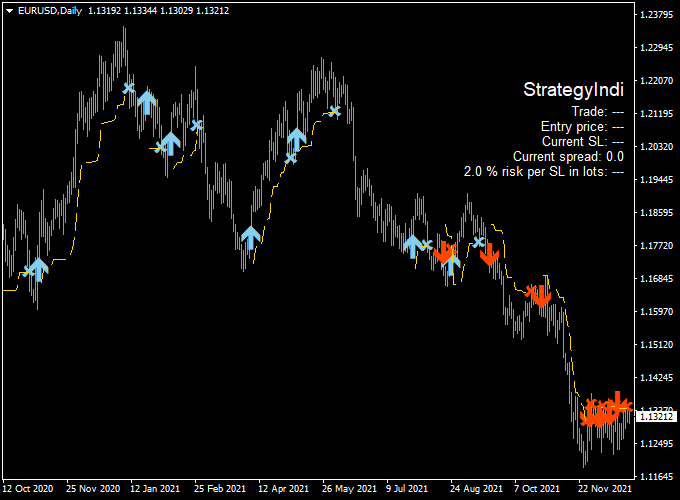
Indicator Chart
The chart below shows the Forex Strategy Indicator applied to an MT4 chart.
Blue arrows mark buy opportunities, while red arrows highlight sell setups.
The mini dashboard displays essential trade info, allowing traders to quickly assess the market and execute trades confidently.

Guide to Trade with the Forex Strategy Indicator
Buy Rules
- Wait for a blue signal arrow to appear
- Confirm that the market is not near strong resistance levels
- Open a buy trade at the next candle open
Sell Rules
- Wait for a red signal arrow to appear
- Confirm that the market is not near strong support levels
- Open a sell trade at the next candle open
Stop Loss
- For buy trades, place the stop loss below the recent swing low or support zone
- For sell trades, place the stop loss above the recent swing high or resistance zone
- Adjust stop distance according to the timeframe and market volatility
Take Profit
- Target recent support or resistance levels
- Use a risk-to-reward ratio of at least 1:2
- Consider trailing stops as price moves favorably
Practical Tips
- Confirm signals with the mini dashboard before opening trades
- Focus on signals that align with higher timeframe trends
- Test the indicator on a demo account to understand optimal entries and exits
Forex Strategy Indicator + XP Moving Average MT4 Scalping Strategy
This MT4 scalping strategy combines the Forex Strategy Indicator and the XP Moving Average Indicator to capture short-term price movements.
The Forex Strategy Indicator provides blue arrows for buy signals and red arrows for sell signals, with take profit indicated at the “X” symbol.
The XP Moving Average confirms the trend: green line for bullish and red line for bearish.
This strategy is suitable for 1-minute to 5-minute intraday charts.
Buy Entry Rules
- Confirm the XP Moving Average Indicator shows a green line, indicating a bullish trend.
- Wait for a blue buy arrow from the Forex Strategy Indicator.
- Enter a buy trade at the close of the candle, showing the blue arrow.
- Set a stop loss just below the recent swing low.
- Set take profit between 5–15 pips or exit when the “X” symbol appears.
Sell Entry Rules
- Confirm the XP Moving Average Indicator shows a red line, indicating a bearish trend.
- Wait for a red sell arrow from the Forex Strategy Indicator.
- Enter a sell trade at the close of the candle, showing the red arrow.
- Set a stop loss just above the recent swing high.
- Set take profit between 5–15 pips or exit when the “X” symbol appears.
Advantages
- Quick signals suitable for intraday scalping.
- Trend confirmation reduces false entries.
- Clear entry and exit points simplify trade execution.
Drawbacks
- Requires high concentration and fast decision-making due to short-term trades.
- Frequent trading can lead to higher transaction costs and spread exposure.
- Limited profit per trade; must rely on multiple trades for meaningful gains.
- Overtrading risk if signals are interpreted without patience and discipline.
- Not suitable for traders who cannot monitor the chart continuously.
Case Study 1: EUR/GBP M1 Chart
The XP Moving Average Indicator showed a green line for a bullish trend.
A blue buy arrow appeared from the Forex Strategy Indicator.
A buy trade was entered at 0.8870 with a stop loss at 0.8865 and take profit at 0.8880 (10 pips).
Price moved upward, hitting the take profit within 5 minutes.
Case Study 2: USD/CHF M1 Chart
The XP Moving Average Indicator showed a red line for a bearish trend.
A red sell arrow appeared from the Forex Strategy Indicator.
A sell trade was entered at 0.9110 with a stop loss at 0.9115 and take profit at 0.9100 (10 pips).
Price declined, reaching the take profit target within 6 minutes.
Strategy Tips
- Use 1-minute to 5-minute charts for intraday scalping.
- Trade during active sessions like London and New York for optimal volatility.
- Wait for both indicators to confirm the trade before entering.
- Employ tight stop losses and predefined take profit levels (5–15 pips) for risk management.
Download Now
Download the “forex-strategy-indicator.mq4” indicator for Metatrader 4
FAQ
How does the mini dashboard help in trading?
The mini dashboard provides an at-a-glance view of the current trade direction and status, helping traders confirm signals without constantly checking multiple indicators.
Can I rely solely on the arrows for trading?
While the arrows provide ready-to-trade signals, combining them with price action, support/resistance, or trend confirmation improves trade accuracy and reduces false entries.
Is the indicator suitable for all currency pairs?
Yes, it works on all Forex pairs, but major pairs with higher liquidity typically give more reliable signals.
Can this indicator be used for scalping and swing trading?
Yes. For scalping, use shorter timeframes like M5 or M15. For swing trading, H1 to H4 charts are ideal to capture longer trends.
Does the indicator work during news releases?
It works during news sessions, but high volatility may produce unreliable signals. It is recommended to be cautious and possibly avoid trading during major news events.
Summary
The Forex Strategy Indicator for MT4 provides a complete and easy-to-follow trading solution.
Blue and red arrows simplify trade execution, while the mini dashboard provides quick insight into market conditions.
For optimal results, traders can combine it with trend or momentum filters and disciplined risk management.
This setup is ideal for both beginners and experienced traders looking for a ready-to-use MT4 trading strategy.


