About the Fractals Indicator
The Fractals Indicator for MT5 is a technical tool that identifies recurring price patterns, known as fractals, and plots them directly on the main chart.
Gray fractal markers indicate potential points where the market may reverse or continue a trend, helping traders identify high-probability trade setups.
Fractals work best when combined with the overall market trend or other indicators to confirm trade direction.
The indicator is designed for all currency pairs and timeframes, making it suitable for scalping, intraday, and swing trading.
Traders are advised to practice on a demo account until they are comfortable interpreting fractal signals.
While fractals highlight key turning points in the market, no indicator guarantees a 100% win rate.
Using proper risk management, stop losses, and take profits is essential for successful trading.
Free Download
Key Features
- Identifies potential reversal points with gray fractal markers on the main chart.
- Works across all currency pairs and multiple timeframes.
- Can be used as a standalone tool or alongside other trend-following indicators.
- Helps traders recognize high-probability entry and exit points.
- Lightweight and efficient for MT5 platforms.
- Supports scalping, intraday, and swing trading strategies.
Indicator Chart
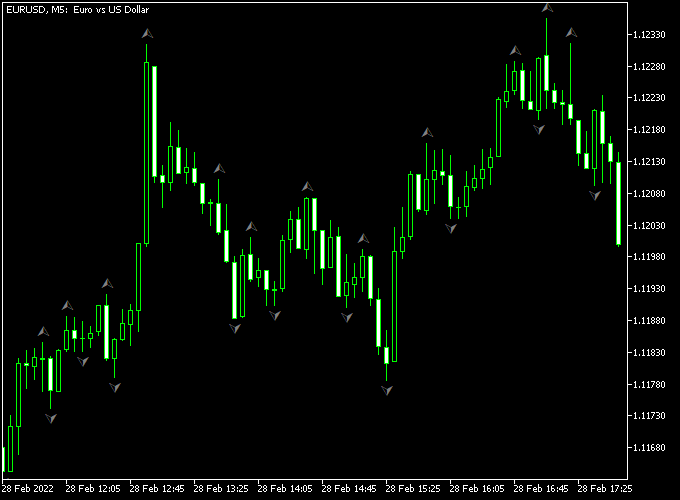
The Fractals Indicator plots gray markers on the main chart, showing where local highs and lows have formed.
Up fractals mark potential sell points, and down fractals mark potential buy points.
The chart illustrates how these fractals can highlight areas of potential trend reversal.

Guide to Trade with Fractals Indicator
Buy Rules
- Identify a down fractal forming at a potential support level.
- Confirm the overall trend is upward or that momentum is shifting bullish.
- Look for price action signals supporting a buy entry.
- Open a buy trade once conditions align.
Sell Rules
- Identify an up fractal forming at a potential resistance level.
- Confirm the overall trend is downward or that momentum is turning bearish.
- Look for price action signals supporting a sell entry.
- Open a sell trade once conditions align.
Stop Loss
- Place stop losses just below the down fractal for buy trades.
- Place stop losses just above the up fractal for sell trades.
- Optionally add a small buffer of a few pips to avoid early exits from volatility.
Take Profit
- Close buy trades near the next resistance or previous swing high.
- Close sell trades near the next support or previous swing low.
- Exit early if an opposite fractal appears or momentum weakens.
- Optionally trail profits to capture extended trends beyond the fractal point.
Download Now
FAQ
How does the Fractals Indicator work?
It identifies recurring patterns of price highs and lows and plots gray fractals on the chart, signaling potential points where the market may reverse or continue a trend.
Can the indicator be used on all timeframes?
Yes. It is suitable for multiple timeframes, from scalping to swing trading, across all currency pairs.
Is the Fractals Indicator reliable on its own?
It can be used alone, but combining it with trend indicators or other technical analysis tools improves accuracy.
Does the indicator guarantee wins?
No. While fractals highlight potential reversal points, no indicator can achieve a 100% win rate. Proper risk management is essential.
Summary
The Fractals Indicator is a practical tool for spotting potential market reversals by marking key price highs and lows with gray fractals.
Its visual signals make it easier for traders to identify possible buy and sell points in alignment with the overall trend.
When combined with proper stop loss and take profit strategies, it provides a structured approach for capturing trend reversals while managing risk effectively.


