
About the FXSSI Advanced Support & Resistance Indicator
The FXSSI advanced Support & Resistance indicator for MT4 is a powerful tool that identifies the best support and resistance levels on any price chart.
It goes beyond mere identification and also calculates the number of times prices have revisited these key levels.
The strength of support and resistance levels is directly correlated with the frequency of price revisits – the more often a level is tested, the stronger it becomes.
Understanding the basics
- The market trend is considered bullish when the candle closes above a significant resistance level, suggesting a buy trade opportunity.
- The market trend is considered bearish when the candle closes below a significant support level, suggesting a sell trade opportunity.
To enhance precision, it’s recommended to combine this indicator with other technical tools, such as an overbought/oversold technical oscillator.
This combination empowers traders to pinpoint the ideal entry price levels for their trades.
Key Points
- Reveals support and resistance levels directly on the chart.
- Works equally well for any Forex pair and time frame.
- Trusted and widely used by traders globally.
- A valuable addition to your collection of trading indicators.
The indicator is highly reliable, lightweight, and will not cause any slowdown in your trading platform.
Free Download
Download the “FXSSI Support&Resistance.ex4” MT4 indicator
Advantages
- Automatic Detection: Eliminates the need for manual plotting of support and resistance levels, saving time and reducing human error.
- Dynamic Projections: Projects identified levels into the future, helping traders anticipate potential price movements.
- Visual Clarity: Utilizes color-coded rectangular zones for easy identification of key levels on the chart.
- Customizable Settings: Offers adjustable parameters to tailor the indicator to individual trading preferences and strategies.
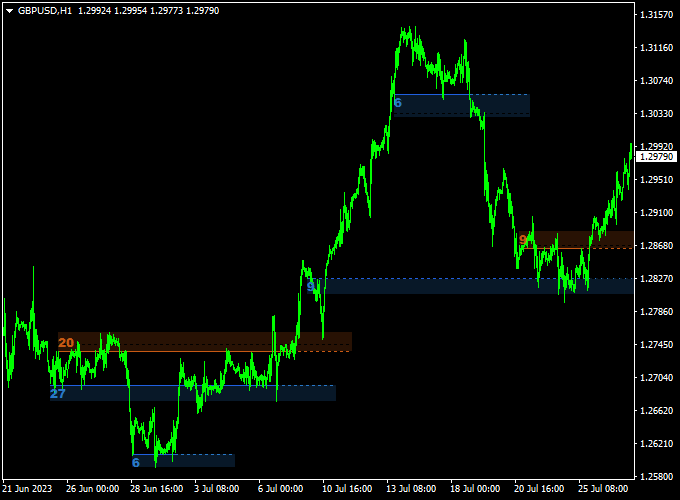
Indicator Example Chart
The chart presented below illustrates the FXSSI advanced Support & Resistance indicator in action on the GBP/USD 1-hour time frame.
Basic Trading Signals From This Indicator
The signals from the FXSSI Support & Resistance indicator are easy to understand. Here’s how they work:
Buy Signal
- A bullish signal is given when the candle closes above the blue colored resistance area.
- Open a buy trade and place a stop loss below the most recent swing low point.
- Close the buy transaction for a risk-to-reward ratio of at least 1.5.
- Optionally, you can implement your preferred take-profit method for buy trades to maximize potential gains.
Sell Signal
- A bearish signal is given when the candle closes below the orange colored support area.
- Open a sell trade and place a stop loss above the most recent swing high point.
- Close the sell transaction for a risk-to-reward ratio of at least 1.5.
- Optionally, you can implement your preferred take-profit method for sell trades to maximize potential gains.
Download Now
Download the “FXSSI Support&Resistance.ex4” MT4 indicator
Support & Resistance Reversal MT4 Strategy Using Stochastic Confirmation
This strategy is built around the FXSSI Advanced Support & Resistance Indicator, which identifies dynamic zones where price is likely to react.
To strengthen trade accuracy, the Stochastic Oscillator is used to confirm overbought or oversold conditions when the price reaches those levels, helping to avoid false breakouts and time entries more effectively.
Ideal Conditions
- Timeframes: M15, M30, H1
- Pairs: EUR/USD, GBP/USD, AUD/USD
- Best Sessions: London, New York
Indicators Used
- Key Level Detector: FXSSI Advanced Support & Resistance
- Reversal Confirmation: Stochastic Oscillator (14, 3, 3)
Buy Setup
- Wait for the price to approach or touch a marked support zone from the FXSSI Support & Resistance Indicator.
- Check that the Stochastic Oscillator is below 20 and starting to curve upward (indicating an oversold condition).
- Enter a buy trade as soon as the price shows bullish behavior (such as bullish engulfing or pin bar) near the support zone.
- Place the Stop Loss just below the support zone or the recent swing low.
- Set the Take Profit near the next resistance zone or use a 1:2 or 1:3 risk-to-reward ratio.
Sell Setup
- Wait for the price to rise into a clearly defined resistance zone displayed by the FXSSI Indicator.
- Check that the Stochastic Oscillator is above 80 and beginning to turn downward (indicating overbought conditions).
- Enter a sell trade when the price shows bearish reversal behavior near the resistance zone.
- Set the Stop Loss just above the resistance zone or the last swing high.
- Set Take Profit near the next support zone or use a 1:2 or 1:3 reward-to-risk ratio.
Risk Management Tips
- Only trade when both indicators align — price near a zone + valid Stochastic signal.
- Risk no more than 2% per trade to preserve long-term capital.
- Use trailing stops when the price moves strongly in your favor.
Strategy Conclusion
The FXSSI Advanced Support & Resistance Indicator excels at identifying key turning points in the market.
When combined with the Stochastic Oscillator, traders can confirm whether the market is overextended at these zones, increasing the accuracy of entries.
This strategy is ideal for reversal traders who prefer precision and discipline over chasing price.
Adjustable Parameters & Settings
Support area color, resistance area color, line color, and width, and breakout sensitivity.
Feel free to explore the indicator’s different parameters and settings to create your personalized indicator setup.
More Info About This Indicator
Currency Pairs: works on any currency pair and other trading instruments
Trading Platform: developed for Metatrader 4 (MT4)
Time Frames: works on any time frame
Indicator Type: support/resistance
Final Word
The FXSSI Advanced Support & Resistance Indicator for MT4 is an invaluable tool for traders seeking to enhance their technical analysis.
By automating the identification of critical price levels and providing dynamic projections it allows traders to focus more on strategy and less on manual chart analysis.
Whether you’re a novice or an experienced trader, this indicator can be a valuable addition to your trading toolkit.


