
The Gioteen Norm indicator for Metatrader 5 provides powerful market insights and can help you in identifying better trade entries and exits.
It’s an oscillator that monitors changes in trends and can signal possible trend reversals.
The Gioteen Norm indicator can also be used for divergence trading.
The indicator contains the following inputs and parameters: period, method, style, and color.
First, familiarize yourself with this technical indicator and test it on a demo account.
It supports all time frames and Forex pairs.
Download Indicator 🆓
GioteenNorm.mq5 Indicator (MT5)
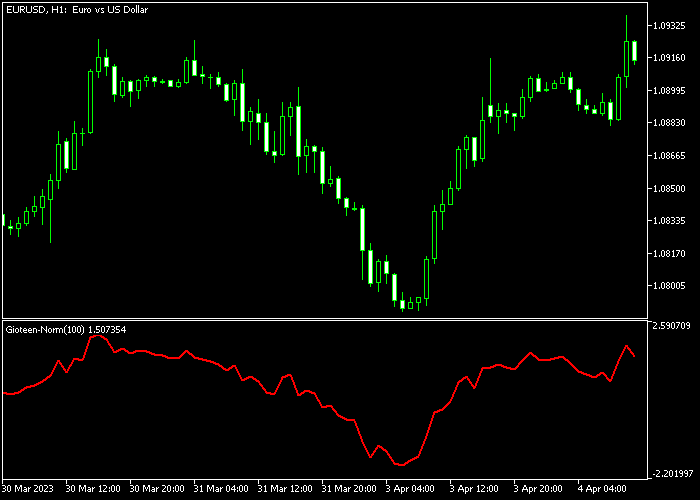
Chart Example
The following chart shows what the Gioteen Norm Forex indicator looks like when applied to the MT5 chart.
How To Buy And Sell Forex Pairs With The Gioteen Norm Forex Indicator?
Find a simple trading example below:
Buy Signal
- A possible bullish trend reversal occurs when the price makes lower lows and the Gioteen Norm indicator makes higher lows.
- Open a buy trade and place your stop loss below technical support.
- Close the buy trade near prior key resistance, or use your own take profit strategy.
Sell Signal
- A possible bearish trend reversal occurs when the price makes higher highs and the Gioteen Norm indicator makes lower highs.
- Open a sell trade and place your stop loss above technical resistance.
- Close the sell trade near prior key support, or use your own take profit strategy.
Download Now 🆓
GioteenNorm.mq5 Indicator (MT5)
Frequently Asked Questions
How Do I Install This Custom Indicator On Metatrader 5?
- Open the MT5 trading platform
- Click on the File menu button located at the top left part of the platform
- Click on Open Data Folder > MQL5 folder > Indicators
- Copy the GioteenNorm.mq5 indicator file in the Indicators folder
- Close and restart the trading platform
- You will find the indicator here (Navigator window > Indicators)
- Drag the indicator to the chart to get started with it!
How Do I Edit This Indicator?
- Click in the open chart with your right mouse button
- In the dropdown menu, click on Indicator List
- Select the indicator and click on properties
- Now you can edit the inputs, colors, levels, scale and visualization
- Finally click the OK button to save the new configuration


