About the Linear Weighted Moving Average (LWMA) Indicator
The Linear Weighted Moving Average (LWMA) Indicator for MetaTrader 5 is a trend tool that gives the highest weight to the most recent prices.
It reacts faster to new market moves than simple and exponential moving averages and is therefore popular with intraday traders.
Common LWMA periods include 200, 50, 20, 8, and 5, which cover swing and scalping styles.
A candlestick close above the LWMA is usually treated as bullish, while a close below the LWMA is treated as bearish.
It is particularly useful for scalpers and day traders who want early trend changes and quick bias confirmation.
The main inputs are the LWMA period and the price type.
Free Download
Key Features
- Places more weight on recent price data for a faster reaction to new market moves.
- Responds quicker than simple and exponential moving averages on the same period.
- Commonly used periods include 200, 50, 20, 8, and 5 for different trading styles.
- Best suited for scalpers and day traders who prefer fast trend signals.
Indicator Chart
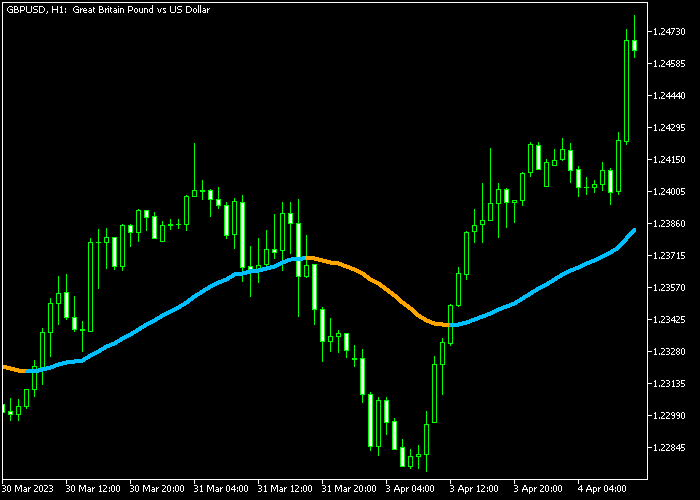
On the chart, the Linear Weighted Moving Average Indicator appears as a colored line plotted directly on the main price window.
The line often uses blue for bullish conditions and orange for bearish conditions to make trend direction easier to see.
When price trades above the rising LWMA line, you focus on buy setups, and when price trades below a falling LWMA line, you look for sells.

Guide to Trade with the LWMA Indicator
Buy Rules
- Wait for the blue LWMA signal line to appear on the price chart.
- Check that recent candles show higher lows and that the LWMA is pointing upward.
- Open a buy trade once a bullish candle closes above the line with enough room to the next resistance.
Sell Rules
- Wait for the orange LWMA signal line to appear on the price chart.
- Confirm that recent candles show lower highs and that the LWMA is sloping downward.
- Open a sell trade after a bearish candle closes below the line with room to the next support.
Stop Loss
- For buy trades, place the stop loss about 3 pips below the previous swing low.
- For sell trades, set the stop loss about 3 pips above the previous swing high.
- Avoid placing stops directly on the LWMA line, as minor pullbacks can tap the line before trend continuation.
Take Profit
- For buys, you can close at a predefined level or wait until a valid sell signal appears.
- For sells, you can exit at your target or wait until a new buy signal shows on the LWMA.
- Scaling out part of the position at key levels while letting a small portion run can help capture stronger trends.
LWMA Indicator with Auto Trend Lines Forex Breakout Strategy for MT5
This strategy combines the Linear Weighted Moving Average (LWMA) indicator with the Auto Trend Lines indicator to trade breakout opportunities during the London and US trading sessions.
The LWMA reacts faster than standard moving averages because it gives more weight to recent price action.
A blue LWMA line signals bullish conditions, while an orange line signals bearish pressure.
This helps define the intraday trend direction before looking for breakout entries.
The Auto Trend Lines indicator automatically draws dynamic support and resistance levels.
A breakout above the blue resistance line suggests bullish continuation, while a break below the red support line signals bearish continuation.
This combination is effective for catching momentum-driven moves during high liquidity sessions.
This strategy is designed for M5 and M15 charts and works best on volatile pairs such as EURUSD, GBPUSD, and USDJPY during the London and US overlap periods.
Buy Entry Rules
- Wait for the LWMA line to turn blue indicating bullish trend conditions.
- Identify a blue resistance line from the Auto Trend Lines indicator.
- Wait for a candle to close clearly above the blue resistance line.
- Enter a buy trade at the opening of the next candle after the breakout.
- Place a stop loss below the broken resistance line or below the recent swing low.
- Close the trade when price shows clear rejection of upward movement or when a new opposite trend line forms and price fails to continue higher.
Sell Entry Rules
- Wait for the LWMA line to turn orange indicating bearish trend conditions.
- Identify a red support line from the Auto Trend Lines indicator.
- Wait for a candle to close clearly below the red support line.
- Enter a sell trade at the opening of the next candle after the breakout.
- Place the stop loss above the broken support line or above the recent swing high.
- Close the trade when price shows clear rejection of downward movement or when a new opposite trend line forms and price fails to continue lower.
Case Study 1
On the EURUSD M15 chart during the London session, the LWMA turned blue after a short consolidation phase, indicating bullish momentum building in the market.
Shortly after, price approached a blue resistance line drawn by the Auto Trend Lines indicator.
A candle closed above the resistance line, confirming a breakout.
A buy trade was entered at the next candle open.
Price expanded upward with strong momentum and continued without major pullbacks.
About 3 hours later, price started to slow and a new descending trend line formed while price failed to push higher, so the trade was closed.
Case Study 2
On the GBPUSD M5 chart during the US session, the LWMA shifted to orange after a strong upward move, indicating bearish transition.
Shortly after, price tested a red support line from the Auto Trend Lines indicator.
A candle closed below the support line, confirming a breakdown.
A sell trade was entered at the next candle open. Price moved lower quickly with strong intraday momentum.
Around 1.5 hours later, price began consolidating near a newly formed upward trend line and failed to extend lower, so the short trade was closed.
Download Now
FAQ
Why do traders prefer the LWMA over a simple moving average?
Traders who want faster signals often prefer the LWMA because it gives more weight to recent prices.
What LWMA period works best for day trading?
Many day traders use shorter LWMA periods such as 20, 8, or 5 to track intraday swings.
These settings react quickly to new moves while still smoothing minor noise.
Can I combine the LWMA with other indicators?
Yes, the LWMA works well with tools like support and resistance, oscillators, or higher timeframe trend filters.
For example, you can trade LWMA signals only in the direction of a higher timeframe moving average.
Summary
The Linear Weighted Moving Average Indicator is a fast moving average that highlights recent price action more than older data.
It is ideal for scalpers and day traders who need quick trend information on many instruments.
Simple rules based on price closing above or below the LWMA keep entries and exits easy to follow.
Combined with support, resistance, and basic price action, it can become a solid trend filter in a short term trading strategy.


