
About the Guppy Double Smoothed indicator
The Guppy Double Smoothed Forex trend indicator for MT5 uses double smoothing and works in a similar fashion to the classic Guppy indicator.
By applying a double smoothing technique to exponential moving averages, this indicator reduces price noise while maintaining high responsiveness to trend shifts.
It helps traders distinguish between minor price corrections and genuine trend reversals by visualizing the relationship between short-term and long-term market sentiment.
This is truly a great popular trend indicator that filters out false trading signals.
Free Download
guppy_mma_of_double_smoothed_ema.mq5 Indicator (MT5)
Key Features
- The indicator consists of two groups of moving averages representing short-term and long-term price trends.
- Double smoothing logic significantly reduces lag compared to standard moving average indicators.
- Color-coded green and red sets provide immediate visual confirmation of current market bias.
- Users can customize the price constant and color schemes to fit individual chart preferences.
Indicator Chart
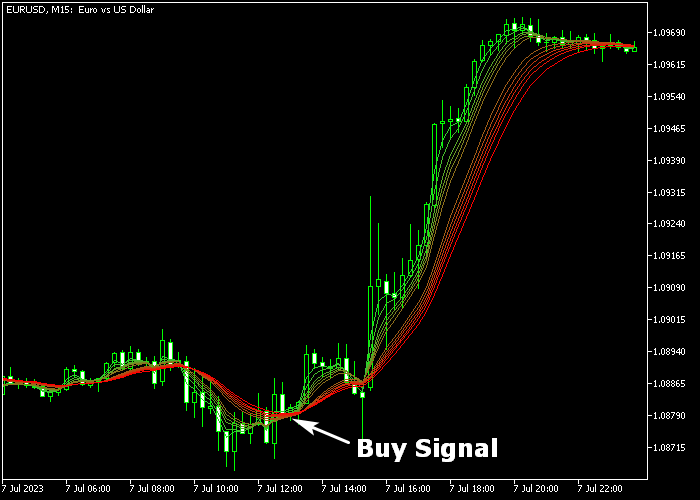
The chart below displays the Guppy Double Smoothed indicator with green and red moving average ribbons.
You can see how the green lines represent short-term momentum while the red lines track the long-term trend.
Crossovers between these two groups signal the start of a fresh directional move.
Guide to Trade with Guppy Double Smoothed indicator
Buy Rules
- A buy signal is confirmed when the green colored Guppy Double Smoothed MAs cross above the red colored MAs.
- Execute a buy market order once the short-term ribbon is fully positioned above the long-term ribbon.
- Ensure the price action is consistently staying above both sets of moving averages to validate trend strength.
- Maintain the long position as long as the green ribbon remains above the red ribbon and the gap is widening.
Sell Rules
- A sell signal is confirmed when the green colored Guppy Double Smoothed MAs cross below the red colored MAs.
- Open a sell market order as soon as the bearish crossover is established and confirmed on a closed candle.
- Verify that the price action is trading below the red group of averages to support the downward bias.
- Keep the short trade active until the green ribbon starts to cross back above the red lines.
Stop Loss
- Place your stop loss below the most recent swing low point for all buy market orders.
- Set a protective stop loss above the most recent swing high point for sell positions.
- The red long-term ribbon can also serve as a dynamic reference for trailing your stop as the trend progresses.
- Always place stops at a distance that protects your capital from unexpected volatility spikes.
Take Profit
- Exit the buy position when the short-term green ribbon crosses back below the long-term red ribbon.
- For short trades, close the position when the green MAs cross above the red MAs, signaling a bullish reversal.
- Targeting major support and resistance levels on the chart is a recommended exit method.
Guppy Double Smoothed Trend MT5 Scalping Strategy with AO
This scalping strategy focuses on capturing short bursts of momentum by combining trend structure with precise timing.
The Guppy Double Smoothed Trend Indicator helps define the overall market direction through moving average crossovers.
When the green moving averages cross above the red ones, it signals a bullish trend, while the opposite crossover indicates bearish conditions.
The Awesome Oscillator Indicator adds momentum confirmation by showing shifts around the zero level.
When the histogram moves above zero, it reflects increasing bullish momentum, and when it drops below zero, it signals growing bearish pressure.
This combination is effective on M1 and M5 timeframes and suits traders who prefer quick trades during active market sessions.
Buy Entry Rules
- Wait for the green Guppy moving averages to cross above the red moving averages, confirming a bullish trend.
- Ensure price is moving smoothly in an upward direction without strong resistance nearby.
- Enter a buy trade when the Awesome Oscillator histogram crosses back above the zero level.
- Place the stop loss below the most recent swing low.
- Close the trade when the histogram drops below zero or when the Guppy lines begin to compress.
- Alternatively, exit near a short-term resistance level.
Sell Entry Rules
- Wait for the green Guppy moving averages to cross below the red moving averages, confirming a bearish trend.
- Check that price is forming lower highs and maintaining downward pressure.
- Enter a sell trade when the Awesome Oscillator histogram crosses back below the zero level.
- Place the stop loss above the recent swing high.
- Close the trade when the histogram rises above zero or when the Guppy lines start tightening.
- Alternatively, target a nearby support level.
Case Study 1: EUR/AUD Buy Trade (M5)
During the London session, EUR/AUD showed a clear bullish crossover as the green Guppy moving averages moved above the red ones.
Price began trending upward with steady momentum.
Shortly after a minor pullback, the Awesome Oscillator crossed above the zero line, confirming renewed buying strength.
A buy trade was opened at the next candle. The stop loss was placed below a recent low.
Price continued rising in a clean move.
The trade was closed when the histogram dipped back toward the zero line, securing a quick intraday gain.
Case Study 2: USD/CAD Sell Trade (M1)
On the M1 timeframe, USD/CAD entered a bearish phase during the New York session.
The Guppy moving averages crossed downward, with red lines dominating the structure.
As price pulled back slightly, the Awesome Oscillator dropped below the zero line again, signaling continuation of bearish momentum.
A sell trade was executed at the next candle. The stop loss was placed above a nearby high.
Price declined quickly in line with the trend.
The short position was closed when momentum weakened and the histogram began rising, capturing a 10 pip fast scalp.
Download Now
guppy_mma_of_double_smoothed_ema.mq5 Indicator (MT5)
FAQ
How does double smoothing benefit my trading?
Double smoothing reduces the jaggedness of standard averages.
This results in cleaner signals that are less susceptible to false breakouts while still reacting quickly to significant trend changes.
What does it mean when the ribbons expand?
Expanding ribbons indicate that the trend is gaining strength and momentum.
It shows that both short-term traders and long-term investors agree, supporting a sustained price move.
Can I use this for day trading?
Yes, it is very effective on lower timeframes like the 15-minute or 1-hour charts.
It helps day traders stay with the daily trend while filtering out minor intraday fluctuations.
Summary
The Guppy Double Smoothed indicator is a popular trend analysis tool offering reliable signals for buying and selling pairs in the Forex market.
It identifies the relationship between short-term and long-term trends without the lag found in traditional indicators.
By visualizing market sentiment through two sets of averages, it provides a disciplined trade logic for momentum trading.
Overall, it is a robust and responsive tool for capturing significant price moves across any timeframe.


