
About the Indicator
The High Probability Forex Oscillator is an advanced MT4 tool that measures momentum and trend strength using color-coded histogram bars.
It helps traders identify strong entry zones and avoid low-probability setups in Forex markets.
Key Features
- Multi-colored oscillator histogram for momentum clarity
- Differentiates between strong, weak, and neutral momentum
- Suitable for all currency pairs and timeframes
- Non-repainting, real-time signal display
- Alerts via pop-up and sound on key momentum shifts
How It Works
The indicator plots a histogram above/below a midline. Colors represent momentum states:
- Green: Bullish momentum
- Red: Bearish momentum
Transitions between these colors signal momentum shifts that can trigger entries or exits.
Free Download
Download the “ary-aind-indicator.mq4” indicator for MT4
Benefits of Using This Indicator
- Helps filter out low-probability trades in choppy markets
- Provides clear visual cues for momentum strength and shifts
- Works across multiple timeframes and pairs
- Supports disciplined entries/exits with objective signal colors
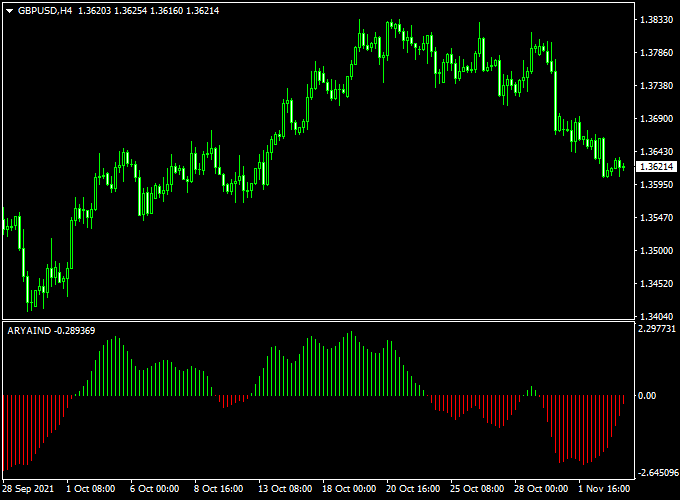
Indicator Example Chart (GBP/USD H4)
How To Trade Using This Tool
- Initiate a buy trade order whenever the colored histogram bars flip color from red to green.
- Initiate a sell trade order whenever the colored histogram bars flip color from green to red.
- Exit the trade when an opposite trading signal appears on the chart, or close for a fixed profit target of your preference.
Download Now
Download the “ary-aind-indicator.mq4” indicator for Metatrader 4
High Probability Oscillator + ASC Trend Forex Strategy for MT4
This trading strategy merges two powerful confirmation tools: the High Probability Forex Oscillator and the ASC Trend Forex Indicator.
Together, they deliver precise entries based on momentum and trend alignment.
While the oscillator measures overbought/oversold zones with high-confidence signal zones, the ASC Trend provides timely directional arrows to guide entries.
What Is This Strategy About?
The strategy aims to identify trend-continuation setups that occur when momentum aligns with a new ASC signal.
The oscillator avoids false entries by requiring the price to reach high-probability zones before entry.
This combination makes the system ideal for traders who want to reduce noise and focus on high-quality setups during trending markets.
Buy Rules
- Wait for the High Probability Forex Oscillator to rise from the oversold area and turn green, suggesting bullish momentum.
- Then wait for a fresh blue up arrow from the ASC Trend Indicator.
- Enter a buy trade at the open of the next candle after both signals align.
- Set stop loss below the most recent swing low or below the oscillator’s oversold boundary.
- Target a 1:2 risk/reward ratio or close the trade when the oscillator reaches the overbought zone and flattens.
Sell Rules
- Wait for the High Probability Oscillator to drop from the overbought area and turn red, indicating bearish pressure.
- Then look for a new red down arrow from the ASC Trend Forex Indicator.
- Enter a sell position at the next candle open after confirmation.
- Place a stop loss above the recent swing high or above the oscillator’s overbought zone.
- Exit at a 1:2 risk/reward or when the oscillator reaches oversold and starts to reverse.
Advantages
- High-quality signals: Combines momentum and trend filtering to reduce low-probability trades.
- Visually intuitive: ASC arrows and oscillator color shifts make signals easy to interpret.
- Flexible timeframes: Effective on M15, H1, and H4 charts.
- Low false signals: Waits for oscillator confirmation before acting on ASC arrows.
Drawbacks
- Lag in consolidation: May produce fewer signals in sideways markets.
- Requires patience: You must wait for both signals to align, which can reduce trade frequency.
- Less suitable for news spikes: Avoid using during high-impact economic releases.
Thoughts
The combination of the High Probability Forex Oscillator and the ASC Trend Forex Indicator creates a dependable system for traders looking to capitalize on clean trend moves with clear momentum backing.
It helps avoid emotional entries and provides strong confirmation before entering the market.
Use it during trending sessions and avoid low volatility periods for the best results.
Examples, Back-Test, Pros & Cons
Back-tests on EUR/USD H1 and GBP/USD H4 show this oscillator excels in trending conditions, offering strong entry signals when momentum intensifies.
In ranging markets, it’s best combined with trend filters like EMA or ADX.
- Pros: Clear momentum visualization, objective signal rules, effective in trends
- Cons: May lag in sudden reversals; false signals during low volatility
Indicator Specifications
| Property | Details |
|---|---|
| Name | High Probability Forex Oscillator |
| Platform | MetaTrader 4 (MT4) |
| Timeframes | All (common: M15, M30, H1, H4) |
| Pairs | Majors, minors, and exotics |
| Signal Type | Colored histogram bars |
| Inputs |
|
Final Words
The High Probability Forex Oscillator is a user-friendly yet powerful tool that gives clear insights into momentum strength and ideal entry zones.
When paired with trend filters and sound risk management, it becomes a valuable component of a disciplined trading strategy.


