
About the Jebatfx Breakout Trend Line Indicator
The Jebatfx Breakout Trend Line Indicator for MT4 is a price action tool that draws dynamic breakout trend lines on the chart, helping traders identify potential buy and sell opportunities.
It also provides suggested profit targets for each trade, allowing traders to plan entries and exits more effectively.
The indicator automatically plots green resistance trend lines and red support trend lines.
A break above a green resistance line signals a buy opportunity, while a break below a red support line signals a sell opportunity.
Traders can enhance entries by combining the indicator with candlestick patterns or other confirmation tools.
Free Download
Download the “jebatfx breakout trendline.mq4” indicator for MT4
Key Features
- Displays dynamic breakout trend lines for buy and sell trades
- Green lines indicate resistance, red lines indicate support
- Provides suggested take-profit targets for each trade
- Pure price action based, non-repainting
- Can be combined with candlestick patterns for better entries
Indicator Chart
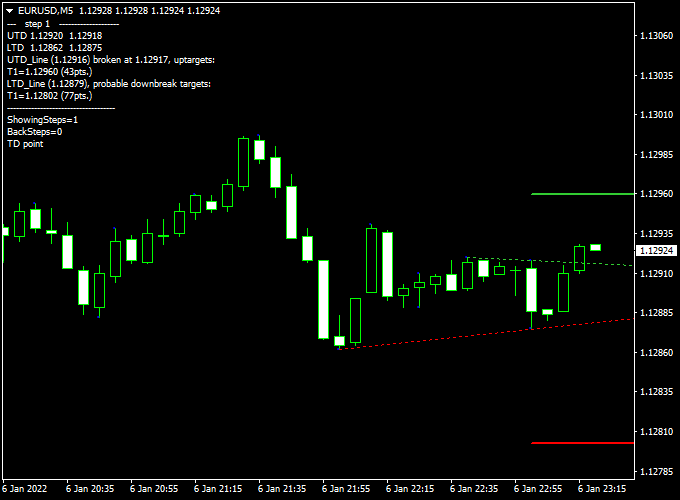
The chart shows the Jebatfx Breakout Trend Line Indicator applied to an MT4 price chart.
Green lines indicate resistance levels and potential buy breakouts, while red lines mark support levels and potential sell breakouts.
The suggested profit targets are shown alongside the trend lines for effective trade management.
Guide to Trade with the Jebatfx Breakout Trend Line Indicator
Buy Rules
- Enter a buy trade when price breaks above a green resistance trend line
- Confirm the breakout with trend direction or candlestick patterns
- Optionally combine with other indicators for higher probability entries
Sell Rules
- Enter a sell trade when price breaks below a red support trend line
- Confirm the breakout with trend direction or candlestick patterns
- Use additional confirmation if needed to avoid false breakouts
Stop Loss
- For buy trades, place a stop loss below the broken resistance trend line
- For sell trades, place a stop loss above the broken support trend line
Take Profit
- Use the suggested profit target displayed by the indicator
- Consider partial exits near intermediate resistance or support levels
- Exit early if an opposite breakout occurs
Practical Tips
- Combine with candlestick patterns for higher accuracy
- Wait for a confirmed close beyond the trend line before entering
- Check higher timeframes to ensure alignment with the overall trend
JebatFX Breakout Trend Line + Trend Envelopes MT4 Intraday Strategy
This intraday strategy combines the JebatFX Breakout Trend Line MT4 Indicator and the Trend Envelopes MT4 Indicator to capture short-term trend breakouts.
The JebatFX Breakout Trend Line signals bullish momentum when the price breaks above a green dotted trend line and bearish momentum when it breaks below a red dotted trend line.
The Trend Envelopes indicator confirms the market trend with blue lines for bullish trends and yellow lines for bearish trends.
This combination helps traders enter trades with trend confirmation, increasing the probability of profitable intraday moves.
This strategy works best on M5 and M15 charts, making it suitable for traders targeting intraday moves within hours.
Buy Entry Rules
- Confirm that the Trend Envelopes line is blue, indicating a bullish trend.
- Wait for the price to break above a green dotted trend line from the JebatFX Breakout Trend Line indicator.
- Enter a buy trade at the close of the breakout candle.
- Set a stop loss below the most recent swing low or 10–15 pips below entry.
- Set take profit at 1:1.5 risk-reward ratio or exit when the Trend Envelopes line turns yellow or price breaks below a red dotted trend line.
Sell Entry Rules
- Confirm that the Trend Envelopes line is yellow, indicating a bearish trend.
- Wait for the price to break below a red dotted trend line from the JebatFX Breakout Trend Line indicator.
- Enter a sell trade at the close of the breakout candle.
- Set a stop loss above the most recent swing high or 10–15 pips above entry.
- Set take profit at 1:1.5 risk-reward ratio or exit when Trend Envelopes line turns blue or price breaks above a green dotted trend line.
Advantages
- Combines breakout signals with trend confirmation for higher probability trades.
- Works well on short-term charts for intraday trading opportunities.
- Helps filter false breakouts by confirming the trend with Trend Envelopes.
- Clear entry and exit rules suitable for both novice and experienced traders.
Drawbacks
- Choppy or sideways markets can produce false breakout signals.
- Requires monitoring due to fast intraday price movements.
- Frequent trading may increase spread and commission costs.
- Stop loss placement is critical; poor positioning can lead to quick losses.
Example Case Study 1: EUR/USD (M5)
The Trend Envelopes line is blue, indicating a bullish trend.
Price breaks above a green dotted trend line on the JebatFX Breakout Trend Line indicator.
Buy trade entered at 1.1050, stop loss at 1.1040, take profit at 1.1075.
Trade reaches take profit within 45 minutes.
Example Case Study 2: GBP/JPY (M15)
The Trend Envelopes line is yellow, indicating a bearish trend.
Price breaks below a red dotted trend line.
Sell trade entered at 151.200, stop loss at 151.350, take profit at 150.950.
The trade reached the take profit within an hour.
Intraday Strategy Tips
- Always trade in the direction of the Trend Envelopes line to improve success probability.
- Check higher timeframes (H1) for trend confirmation before entering trades.
- Avoid trading during major news events to reduce the risk of false breakouts.
- Use proper risk management with stop loss and take profit levels for each trade.
- Combine with support and resistance zones for additional confirmation on entries and exits.
Download Now
Download the “jebatfx breakout trendline.mq4” indicator for Metatrader 4
FAQ
How do I know when a breakout is valid?
A breakout is valid when the price closes beyond the green resistance or red support trend line. Waiting for a confirmed close reduces false signals.
Do I need other tools to trade effectively?
The indicator can be used alone, but combining it with candlestick patterns or trend filters can improve trade accuracy.
What is the recommended session for using this indicator?
Breakouts are generally more reliable during high liquidity sessions, such as London and New York.
Summary
The Jebatfx Breakout Trend Line Indicator for MT4 helps traders spot buy and sell breakouts using dynamic support and resistance lines.
It provides suggested profit targets, making trade management easier.
Using the indicator with trend analysis or candlestick patterns can improve the success rate of breakout trades.
Overall, this indicator is a practical and easy-to-use tool for capturing breakout opportunities and planning trades with clear entry and exit points.


