About the KG Wave Oscillator Indicator
The KG Wave Oscillator indicator for MT4 is a two-colored buy and sell signals oscillator designed for scalpers and short-term traders.
It plots colored bars above and below the zero line, showing bullish and bearish momentum.
Blue bars above zero indicate a bullish trend, while red bars below zero indicate a bearish trend.
The indicator can be used alone or in combination with trend-following tools such as moving averages or Bollinger Bands.
Combining KG Wave with a trend indicator increases the probability of profitable trades.
The indicator is suitable for all timeframes and helps traders spot potential entry points with minimal effort.
Free Download
Download the “kg-wave-minor.ex4” MT4 indicator
Key Features
- Two-colored bars indicating bullish and bearish momentum.
- The oscillator fluctuates above and below the zero level.
- Signals for buy and sell entries are easy to interpret.
- Can be used alone or combined with trend-following indicators.
- Adjustable settings available in the input tab.
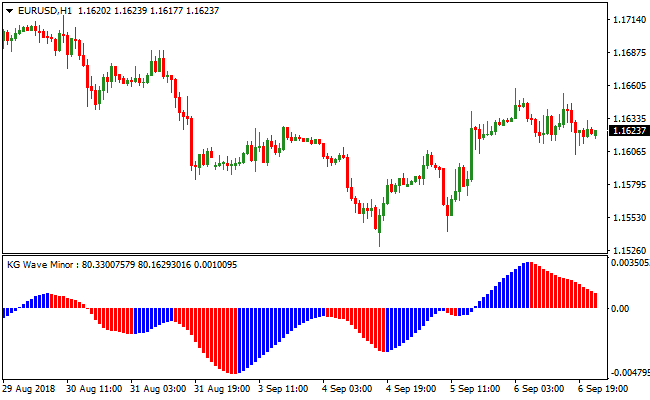
Indicator Chart
The EUR/USD 5-Minute chart below shows the KG Wave Oscillator indicator in action.
Blue bars above the zero line indicate bullish conditions, while red bars below zero indicate bearish conditions.
Traders can use these bars to identify potential entry points and exit trades according to market momentum.

Guide to Trade with the KG Wave Oscillator Indicator
Buy Rules
- Wait for the oscillator bars to cross above the zero line from below.
- Ensure bars are aligned above the zero level for bullish confirmation.
- Optionally confirm the trend with a moving average or other trend indicator.
- Enter a buy trade at the close of the confirming bar.
Sell Rules
- Wait for the oscillator bars to cross below the zero line from above.
- Ensure bars are aligned below the zero level for bearish confirmation.
- Optionally confirm the trend with a moving average or other trend indicator.
- Enter a sell trade at the close of the confirming bar.
Stop Loss
- Place stops below the recent swing low for buy trades or above the recent swing high for sell trades.
- Use a small buffer beyond the zero line to avoid being stopped out prematurely.
Take Profit
- Close trades when the oscillator shows an opposite signal.
- Alternatively, target nearby support or resistance levels.
- Use a fixed pip profit target of your preference.
MT4 Strategy: KG Wave Oscillator + SuperTrend MTF Forex Signal
This MT4 strategy combines the KG Wave Oscillator and the SuperTrend MTF Forex Signal Indicator to identify high-probability intraday trades.
The KG Wave Oscillator shows blue histograms above zero for buy signals and red histograms below zero for sell signals, indicating short-term momentum.
The SuperTrend MTF indicator confirms the overall trend direction with a green line for bullish trends and a red line for bearish trends.
Combining these two indicators helps traders align entries with strong market trends while filtering out weaker moves.
This strategy works best on M15, M30, and H1 charts, making it ideal for day trading.
It is suitable for traders who prefer structured setups with both trend and momentum confirmation to maximize intraday opportunities.
Buy Entry Rules
- The KG Wave Oscillator shows a blue histogram above zero, indicating bullish momentum.
- The SuperTrend MTF line is green, confirming an uptrend.
- Enter the trade when both indicators align.
- Place stop loss below the recent swing low or key support level.
- Take profit when the KG Wave Oscillator turns red or the SuperTrend MTF line changes to red, or after capturing 20-35 pips.
Sell Entry Rules
- The KG Wave Oscillator shows a red histogram below zero, indicating bearish momentum.
- The SuperTrend MTF line is red, confirming a downtrend.
- Enter the trade when both indicators align.
- Place a stop loss above the recent swing high or key resistance level.
- Take profit when the KG Wave Oscillator turns blue or the SuperTrend MTF line changes to green, or after capturing 20-35 pips.
Advantages
- Combines trend confirmation with momentum signals for higher probability trades.
- Effective for day trading on multiple timeframes and currency pairs.
- Helps filter out counter-trend trades by requiring both trend and momentum alignment.
- It can be used to monitor several pairs simultaneously for intraday opportunities.
Drawbacks
- Signals may be less reliable during low volatility or sideways markets.
- Requires waiting for the alignment of both indicators, which may result in missed early entries.
- Traders may become reliant on indicators, overlooking price action and support/resistance levels.
Case Study 1: EURJPY M30
During the London session, EURJPY displayed a blue KG Wave histogram above zero and a green SuperTrend MTF line.
A buy trade was entered with a stop below the recent swing low.
Price moved upward steadily, and the trade was closed when the KG Wave histogram turned red, capturing 28 pips.
Combining trend and momentum signals allowed a reliable intraday trade.
Case Study 2: AUDUSD H1
AUDUSD showed a red KG Wave histogram below zero and a red SuperTrend MTF line during the New York session.
A sell trade was executed with a stop above the recent swing high.
Price declined over the session and the trade was closed when the KG Wave histogram turned blue, securing 32 pips.
Strategy Tips
- Focus on major and liquid currency pairs during active sessions for more reliable trend moves.
- Place stop losses at logical swing points or support/resistance levels to manage risk.
- Take profits when the KG Wave histogram or SuperTrend MTF line changes color, or after reaching 20-35 pip targets.
- Check higher timeframes briefly to ensure the intraday trend aligns with the broader market direction.
Download Now
Download the “kg-wave-minor.ex4” Metatrader 4 indicator
FAQ
Should it be combined with other indicators?
While it can be used alone, pairing it with a trend-following indicator improves the accuracy of buy and sell signals.
How do I interpret the zero line?
Bars above zero indicate bullish momentum; bars below zero indicate bearish momentum. Crosses of the zero line generate entry signals.
Summary
This indicator provides easy-to-read, two-colored buy and sell signals above and below the zero line.
It helps traders spot trend momentum, confirm entries, and manage exits efficiently.
Its flexibility allows use as a standalone scalping tool or combined with trend-following indicators.
Customizable settings, clear visual bars, and simple interpretation make it a reliable tool for improving trading consistency.


