
About the Linear Regression Indicator
The Linear Regression indicator for MT5 helps traders identify the prevailing trend by smoothing price action in a way similar to moving averages.
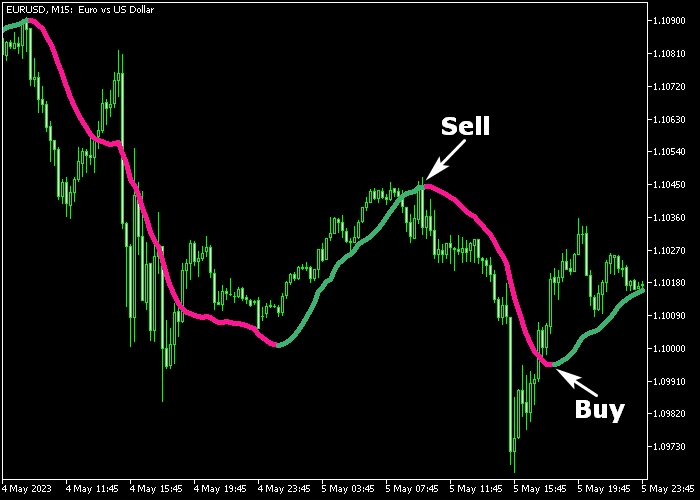
It displays a dual-colored signal line directly on the price chart, with green showing bullish trends and magenta indicating bearish trends.
Traders can modify the period, price type, color, and line style to adapt the indicator to different timeframes and market conditions.
The indicator works with any instrument supported by MT5, offering a clear view of market direction while filtering minor fluctuations.
Its simplicity and reliability make it suitable for both novice and experienced traders.
Free Download
Linear regression.mq5 Indicator (MT5)
Key Features
- Dual-colored line for clear bullish and bearish trend identification.
- Customizable period, price type, color, and line style.
- Helps filter market noise to reveal the main trend.
- Flexible for use on multiple timeframes and trading styles.
Indicator Chart
The Linear Regression indicator appears as a colored line overlaid on the main price area.
Green segments suggest potential buying opportunities, while magenta segments indicate selling opportunities.
Traders can use the line to monitor trend direction and confirm entry and exit points for trades.
Guide to Trade with Linear Regression Indicator
Buy Rules
- The green Linear Regression line appears on the chart.
- Confirm bullish momentum with price staying above the line.
- Open a buy trade once the trend is established.
- Hold the position until the line switches to magenta or the market signals a reversal.
Sell Rules
- The magenta Linear Regression line appears on the chart.
- Confirm bearish momentum with price staying below the line.
- Open a sell trade once the trend is confirmed.
- Hold the position until the line turns green or a bullish reversal signal appears.
Stop Loss
- For buy trades, set the stop loss a few pips below the green Linear Regression line.
- For sell trades, place the stop loss a few pips above the magenta Linear Regression line.
- Adjust dynamically depending on market volatility.
Take Profit
- Close buy trades when the line turns magenta or when a predetermined profit target is reached.
- Close sell trades when the line turns green or when a fixed profit target is met.
- Partial exits can help secure profits while letting the trend continue.
Download Now
Linear regression.mq5 Indicator (MT5)
FAQ
Can Linear Regression be used on all timeframes?
Yes, it adapts to any timeframe, though shorter periods give faster signals and longer periods filter noise for swing trading.
Does the indicator repaint its signals?
No, Linear Regression signals remain stable once plotted, allowing traders to rely on historical trend data for strategy decisions.
Is it suitable for beginners?
Absolutely. Its dual-colored line makes trend direction easy to read, which helps new traders follow the market confidently.
How should I adjust the Linear Regression for volatile pairs?
Consider reducing the period slightly to capture more frequent trend changes, and adjust the stop loss to account for higher price swings.
Summary
The Linear Regression Indicator provides a simple yet effective way to follow market trends.
Its dual-colored signal line highlights bullish and bearish phases, making entry and exit points easy to identify.
Adjustable parameters allow traders to tailor the indicator for different timeframes and currency pairs.
Both beginners and experienced traders can benefit from the clear trend signals, making it a reliable tool for improving trading decisions.


