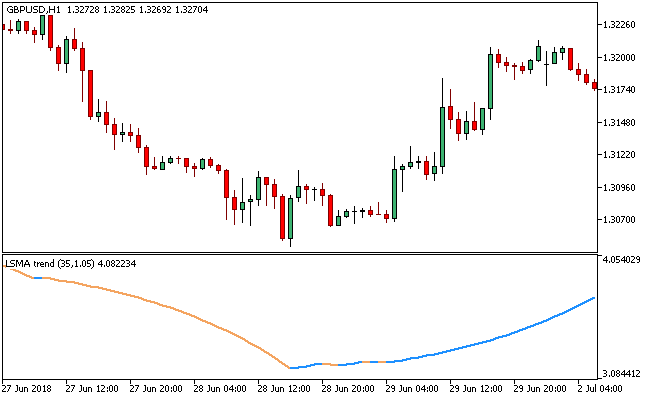
The LSMA Trend Metatrader 5 indicator is used to display trends of the used average and plots it as a type of an oscillator.
LSMA is short for Least Squares Moving Average or Linear Regression Indicator.
The indicator is well known for trend identification and trend following just as seen with moving averages.
Forward projections can be identified from the current period by computing the least squares regression line for the preceding time period.
This means that the LSMA MT5 indicator can suggest likelihood of what is going to occur if the line of regression lingers.
Free Download
Download the “LSMA Trend.ex5” MT5 indicator
Example Chart
The LSMA Metatrader 5 indicator is built on the sum of least squares method to get a straight line that best match data for the period in focus.
The line’s end point is plotted and the procedure repeated on every succeeding period.
There are three available input variable parameters on the LSMA indicator:
Period – explains the moving average calculation period;
Price – explains the moving average calculation price
Acceleration factor – this feature defines the price smoothing factor
There are two important coloring within the LSMA MT5 custom indicator; the sandy brown line indicates a bearish signal, while the dodger blue line depicts bullish price pressures.
Download
Download the “LSMA Trend.ex5” Metatrader 5 indicator
MT5 Indicator Characteristics
Currency pairs: Any
Platform: Metatrader 5
Type: chart window indicator
Customization options: Variable (Period, Price, Acceleration factor), Colors, width & Style.
Time frames: 1-Minute, 5-Minutes, 15-Minutes, 30-Minutes, 1-Hour, 4-Hours, 1-Day, 1-Week, 1-Month
Type: oscillator
Installation
Copy and paste the LSMA Trend.ex5 indicator into the MQL5 indicators folder of the Metatrader 5 trading platform.
You can access this folder from the top menu as follows:
File > Open Data Folder > MQL5 > Indicators (paste here)


