
About the MACD Flat Trend Indicator
The MACD Flat Trend Indicator for MT5 is a technical tool that generates trading signals based on the well known MACD indicator.
It helps traders quickly recognize bullish, bearish, and neutral market conditions through a simple color based bar system.
The indicator appears beneath the main price area and displays colored bars that represent market momentum.
A green bar signals bullish pressure, a red bar indicates bearish pressure, and a gray bar represents neutral market activity.
The indicator is beginner friendly and works well for traders who want a straightforward method to identify potential entries and exits.
Many traders use it during the London and New York sessions, when market activity and volatility are typically higher.
Several settings are available to adjust the indicator.
Traders can modify the fast EMA period, slow EMA period, signal period, applied price, and the bar colors.
Free Download
MACD_Flat_Trend.mq5 Indicator (MT5)
Key Features
- Generates buy and sell signals based on MACD momentum.
- Displays colored bars to represent bullish, bearish, and neutral trends.
- Green bars indicate bullish momentum in the market.
- Red bars indicate bearish momentum.
- Gray bars highlight neutral or sideways conditions.
- Beginner friendly design with easy to interpret signals.
- Adjustable parameters including fast EMA, slow EMA, and signal period.
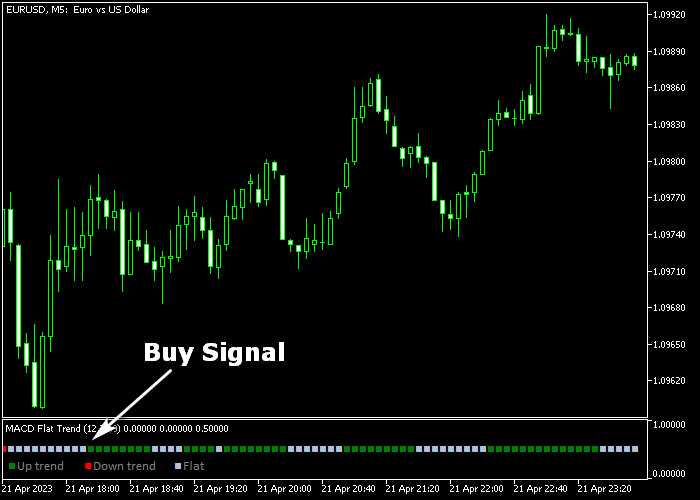
Indicator Chart
The MACD Flat Trend Indicator appears beneath the main price area as green, red, and gray momentum bars.
The colors highlight bullish, bearish, and neutral phases while helping traders recognize potential buy and sell opportunities.
Guide to Trade with MACD Flat Trend Indicator
Buy Rules
- Wait for the first green MACD Flat Trend bar to appear.
- Confirm that bullish momentum is beginning to build.
- Open a buy position once the green bar forms.
- Check market context and ensure the market is not approaching strong resistance.
Sell Rules
- Wait for the first red MACD Flat Trend bar to appear.
- Confirm that bearish momentum is developing.
- Open a sell position once the red bar forms.
- Avoid entering if price is approaching strong support levels.
Stop Loss
- Place the stop loss 3 pips below the previous swing low for buy trades.
- Place the stop loss 3 pips above the previous swing high for sell trades.
- Ensure the stop level allows room for normal price movement.
Take Profit
- Close all buy trades when a red MACD Flat Trend bar appears.
- Close all sell trades when a green MACD Flat Trend bar appears.
- Exit early if momentum clearly weakens before the opposite signal appears.
Download Now
MACD_Flat_Trend.mq5 Indicator (MT5)
FAQ
What do the colors in the MACD Flat Trend Indicator mean?
The indicator uses three colors to represent momentum.
Green bars indicate bullish momentum, red bars show bearish momentum, and gray bars signal neutral market activity.
Is this indicator suitable for beginners?
Yes. The indicator is designed with simple visual signals that make it easy for new traders to recognize potential trading opportunities.
When is the best time to use the indicator?
Many traders prefer using it during the London and New York sessions when market activity and volatility are higher.
Summary
The MACD Flat Trend Indicator offers a simple way to monitor market momentum using color based signals.
By converting MACD data into green, red, and gray bars, the indicator helps traders quickly identify bullish, bearish, and neutral phases.
Its straightforward design makes it accessible for beginners while still being useful for experienced traders.
The signals can be used for scalping, intraday trading, or as confirmation alongside other technical analysis methods.
With customizable parameters and clear momentum signals, the indicator can become a practical addition to many trading strategies.


