About the MACD Trend Candles Forex Indicator
The MACD Trend Candles Indicator for MetaTrader 4 is a practical tool for identifying trend direction and generating buy and sell signals.
It converts MACD momentum into colored candlesticks displayed on the main chart.
Green candlesticks indicate bullish momentum, while red candlesticks indicate bearish momentum.
Traders can use these visual cues to quickly spot trend changes and decide when to enter or exit trades.
In addition to single-timeframe signals, the indicator provides an overall view of the trend across multiple timeframes.
This makes it easier to align trades with higher probability trends and avoid counter-trend entries.
Free Download
Download the “Macd trend candles.ex4” indicator for MT4
Key Features
- Colored candlesticks based on MACD signals
- Green candles for buy signals, red candles for sell signals
- Displays trend across multiple timeframes
- Shows clear trend reversals for easy entries and exits
- Designed for both scalping and intraday trading
- Compatible with all major and minor currency pairs
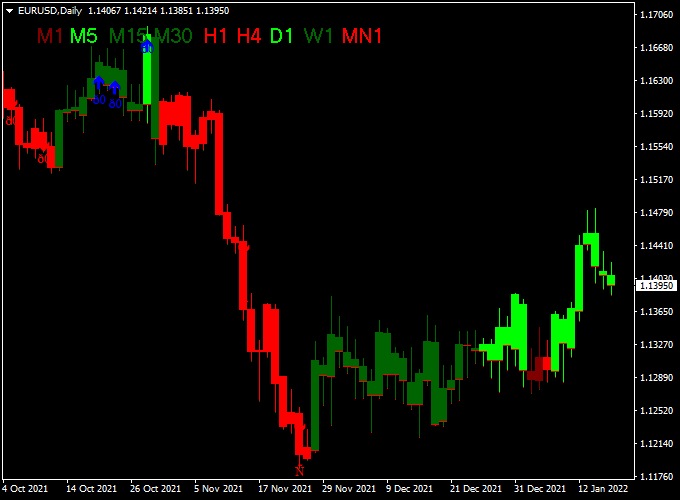
Indicator Chart
The chart below demonstrates the MACD Trend Candles Indicator.
Green candlesticks mark potential buy trades, while red candlesticks mark potential sell trades.
The multi-timeframe trend view helps confirm overall market direction.

Guide to Trade with MACD Trend Candles Forex Indicator
Buy Rules
- Look for the first green candlestick
- Ensure higher timeframe trends support the bullish direction
- Open a buy position when the green candlestick confirms momentum
Sell Rules
- Wait for the first red candlestick
- Confirm that higher timeframe trends align with bearish momentum
- Open a sell position when the red candlestick confirms downward pressure
Stop Loss
- Set stop loss just below the previous swing low for buy trades.
- Set stop loss just above the previous swing high for sell trades.
- Alternatively, use a fixed percentage of the current candle range to account for volatility.
- Adjust stops for higher timeframes to avoid getting stopped out too early.
Take Profit
- Close the trade when the candlestick color changes.
- Use nearby support or resistance levels as potential exit points.
- Consider taking partial profits when the trend is strong but slowing down.
- For scalping, target a fixed number of pips aligned with your session’s average movement.
Practical Tips
- Follow the multi-timeframe trend to avoid counter-trend trades
- Combine signals with support and resistance for better accuracy
- Trade during high-liquidity sessions like London or New York
- Use smaller positions when volatility is high
MACD Trend Candles + AMA Signals MT4 Forex Intraday Strategy
This intraday trading strategy combines the MACD Trend Candles Indicator and the AMA Signals Indicator on MetaTrader 4 (MT4) to identify high-probability buy and sell opportunities.
The MACD Trend Candles provides visual cues through colored candlesticks, while the AMA Signals indicator confirms trend direction via colored dotted lines.
Buy Entry Rules
- Wait for the MACD Trend Candles indicator to display a green candlestick, signaling a potential buy opportunity.
- Confirm that the AMA Signals indicator shows a blue dotted line, confirming an uptrend.
- Enter a buy position at the close of the green candlestick.
- Set a stop loss just below the recent swing low or a fixed number of pips, depending on risk tolerance.
- Set a take profit target using a risk-to-reward ratio of at least 1:2, or exit when the candlestick turns red or the AMA dotted line turns brown.
Sell Entry Rules
- Wait for the MACD Trend Candles indicator to display a red candlestick, signaling a potential sell opportunity.
- Confirm that the AMA Signals indicator shows a brown dotted line, confirming a downtrend.
- Enter a sell position at the close of the red candlestick.
- Set a stop loss just above the recent swing high or a fixed number of pips.
- Set a take profit target using a risk-to-reward ratio of at least 1:2, or exit when the candlestick turns green or the AMA dotted line turns blue.
Advantages
- Clear and easy-to-read visual signals using candlestick colors and dotted trend lines.
- Combines momentum (MACD Trend Candles) with trend direction (AMA Signals) for higher probability trades.
- It can be applied across multiple timeframes, making it versatile for both intraday and swing trading.
- Helps traders identify trend reversals and continuations with minimal lag compared to using a single indicator.
- Reduces guesswork and emotional trading by providing objective entry and exit points.
- Works well in trending markets, improving trade accuracy and potential profit.
Drawbacks
- May produce false signals during sideways or low-volatility markets, leading to small losses or whipsaws.
- The lagging nature of indicators may cause delayed entries, missing part of the initial move.
- Requires active monitoring of charts; not suitable for completely automated or set-and-forget trading.
- Multiple trades in a short period may result in higher transaction costs due to spreads and commissions.
Case Study 1: EUR/USD H1 Buy
On the EUR/USD H1 chart, a green candlestick appeared at 1.1050, followed by a blue dotted line from the AMA Signals indicator.
A buy position was entered at 1.1051 with a stop loss at 1.1031 (-20 pips) and a take profit target at 1.1081 (+30 pips).
The trade moved upward within the session, hitting the take profit for a gain of +30 pips.
Case Study 2: GBP/USD H1 Sell
During the London session, GBP/USD formed a red candlestick at 1.2800, and the AMA Signals indicator showed a brown dotted line.
A sell order was placed at 1.2798 with a stop loss at 1.2818 (-20 pips) and a take profit at 1.2766 (+32 pips).
The price declined steadily and reached the target within 90 minutes, resulting in a +32 pips profit.
Strategy Tips
- Focus on high-liquidity pairs such as EUR/USD, GBP/USD, USD/JPY, and AUD/USD for tighter spreads and cleaner signals.
- Trade during active market sessions, like the London and New York overlap, to increase the likelihood of strong trending moves.
- Combine this strategy with a simple support and resistance analysis to improve trade entries and exits.
- Keep position sizes small and consistent to manage risk, especially when taking multiple trades per day.
- Regularly review past trades to identify patterns where the strategy works best and adjust filters accordingly.
Download Now
Download the “Macd trend candles.ex4” indicator for Metatrader 4
FAQ
How do the candlesticks work?
Green candlesticks show bullish momentum, and red candlesticks show bearish momentum. A color change signals a potential trend reversal.
Can I use this indicator for multiple timeframes?
Yes. The indicator shows both the current timeframe trend and an overall multi-timeframe trend, helping align trades with higher probability directions.
Is this indicator suitable for beginners?
Yes. The colored candles make it easy to follow the trend visually. Beginners can quickly understand when to enter or exit trades.
Summary
The MACD Trend Candles Indicator for MT4 turns MACD signals into clear, colored candlesticks for quick and accurate trade decisions.
Green and red candles indicate buy and sell signals, while multi-timeframe analysis shows the overall market trend.
By using the indicator with stop loss, support and resistance levels, and trend confirmation, traders can make timely entries and exits.
This tool is ideal for scalping and intraday trading, helping identify momentum shifts and reduce the risk of counter-trend trades.


