
About the Money Meter Forex Indicator
The Money Meter Forex indicator for MT4 is a practical account management tool designed to help traders evaluate potential profit and loss before entering a trade.
It focuses on money flow and risk exposure rather than just price direction.
This makes it especially useful for traders who want to align their setups with realistic reward expectations.
The indicator works by analyzing price movement and position parameters to display a dynamic reading.
This reading reflects how much money could be gained if price moves in your favor or lost if it moves against you.
Instead of guessing position quality, traders can visually assess whether a setup is worth taking.
Free Download
Download the “Money meter.mq4” indicator for MT4
Key Features
- Displays real-time potential profit and loss based on current market conditions.
- Helps evaluate risk-to-reward before placing a trade.
- Works on all MT4 currency pairs and timeframes.
- Useful for both discretionary and rule-based trading approaches.
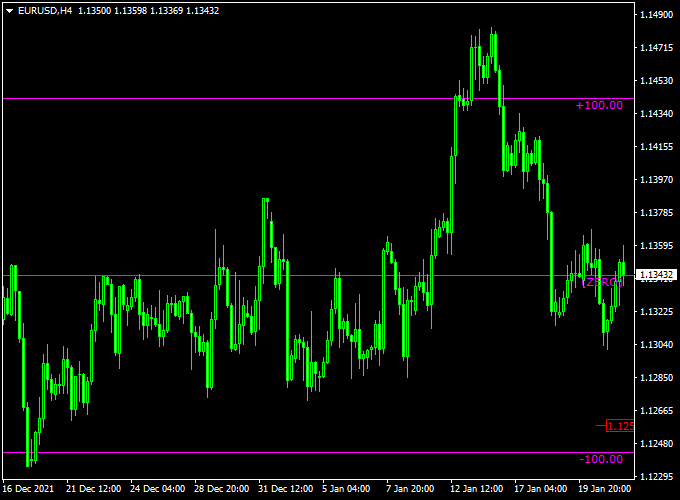
Indicator Chart
The Money Meter Forex indicator chart shows a dynamic meter below the price chart.
On the chart, traders can see the Money Meter reading rise or fall as price changes.
Rising values suggest improving reward potential, while falling values warn of weakening trade quality.
This helps confirm buy and sell decisions with real-time feedback.
Guide to Trade with Money Meter Forex Indicator
Buy Rules
- Identify a valid buy setup using your preferred technical or price action method.
- Check the Money Meter reading.
- The reading should be rising above zero and ideally moving toward +100.
- This indicates favorable profit potential relative to risk.
Sell Rules
- Identify a valid sell setup based on your trading strategy.
- Check the Money Meter reading.
- The reading should be dropping below zero or moving down from higher levels.
- This signals weakening upside potential and negative momentum.
Stop Loss
- Place the stop loss at a technical level such as a recent swing high or low.
- Ensure the Money Meter does not show excessive negative exposure.
- Avoid trades where the meter drops sharply against your position.
Take Profit
- Set take profit where the Money Meter approaches its upper favorable range.
- Combine the meter reading with support or resistance levels.
- Consider partial profits if the meter starts to flatten.
Practical Tips
- Use the Money Meter Forex indicator as a confirmation tool, not as a standalone entry signal.
- Reduce position size if the meter reacts sharply against your trade.
- Review past trades to understand how meter behavior correlates with outcomes.
Money Meter Indicator + Entry-Take-Profit Winner Forex Day Trading Strategy
This strategy combines the Money Meter Forex Indicator MT4 and the Entry Take Profit Forex Winner Indicator MT4 to create a disciplined day-trading approach.
The Money Meter indicator displays two horizontal lines – a zero line and a +100 line – to give you an instant visual gauge of how much potential reward or risk the trade carries.
The Entry Take Profit Winner indicator generates clear buy (blue arrow) and sell (red arrow) signals to mark high-probability entries.
Combining these two tools allows you to pick entries, assess reward versus risk upfront, and manage the trade consciously.
This strategy is designed for intraday time-frames (15 minutes to 1 hour) on major or liquid currency pairs, and is best used by traders comfortable with monitoring and actively managing trades
rather than setting-and-forgetting overnight positions.
Buy Entry Rules
- Wait for a blue arrow from the Entry Take Profit Winner indicator signaling a buy setup.
- Check the Money Meter reading: it should be rising above zero and ideally moving toward +100, indicating favorable profit potential over risk.
- Enter a buy trade after the blue arrow appears and the next candle closes higher than the arrow bar low.
- Place your stop-loss just below the recent swing low (or the low of the arrow candle) with proper risk sizing.
- Set take profit target based on how the Money Meter is behaving: if it is moving toward +100, aim for a reward-to-risk ratio of at least 1:1.5 (e.g., if stop is 10 pips, target about 15 pips or more).
- Otherwise, stay conservative (1:1). You may also exit if the Money Meter retreats toward zero from the +100 line.
Sell Entry Rules
- Wait for a red arrow from the Entry Take Profit Winner indicator signaling a sell setup.
- Check the Money Meter reading: it should be dropping below zero or well below +100 toward zero, indicating a negative risk/reward momentum or that the trade ahead has limited upside.
- Enter a sell trade after the red arrow appears and the next candle closes below the arrow candle’s high.
- Place a stop-loss just above the recent swing high (or the high of the arrow candle). Use position sizing consistent with your risk rules.
- Set take profit target according to the Money Meter reading: aim at least a 1:1 risk/reward and preferably 1:1.5 if the Money Meter shows strong +100 potential in the direction of your trade.
- Exit if the Money Meter moves back toward zero or reverses direction.
Advantages
- Clear visual reward-risk feedback via the Money Meter gives you awareness before entering the trade.
- The arrow signals of the Entry Take Profit Winner indicator simplify decisions and reduce ambiguity around entries.
- Combining the two increases discipline: you only take trades when both the entry signal and favorable risk/reward align.
- Applicable across many pairs and intraday time frames, giving flexibility to day-traders.
Drawbacks
- The strategy depends on the indicator signals being accurate; in low volatility or choppy markets, signals may mislead.
- You must monitor the Money Meter and manage exit if conditions change, so it requires active involvement rather than passive holding.
- If you enter trades when the Money Meter shows weak potential (close to zero), you may win very little or get stopped out despite a correct arrow signal.
- Major news events can distort the Money Meter reading and arrow signals, increasing the risk of false moves.
Example Case Study 1 – USD/CHF (15-min Chart)
During the European session, USD/CHF generated a blue arrow from the Entry Take Profit Winner indicator at approximately 0.8780.
At that time, the Money Meter reading moved upward from around +20 toward +100, indicating strong upside potential.
A buy trade was entered at 0.8783, stop-loss placed at 0.8768 (15 pips risk), take profit set at 0.8808 (25 pips target for about 1:1.7 reward).
The Money Meter moved toward +100, and the trade closed at the target within 45 minutes, netting +25 pips.
Example Case Study 2 – NZD/JPY (30-min Chart)
In the later US session, NZD/JPY gave a red arrow sell signal at around 88.45.
The Money Meter reading at that moment dropped from +50 toward zero, signaling limited upside for a long and favorable downswing potential.
A sell trade was executed at 88.43, stop-loss set at 88.63 (20 pips risk), target set at 88.18 (25 pips target for about 1:1.25 reward).
The trade completed its target within an hour, capturing +25 pips.
Strategy Tips
- Make sure the Money Meter is showing a meaningful move (not flat) before you enter on the arrow; avoid arrows when the meter hovers near zero without movement.
- Use major and liquid pairs (such as EUR/USD, USD/JPY, GBP/USD, USD/CHF, AUD/USD) to minimize spread and slippage and improve the Money Meter signal accuracy.
- Backtest how your chosen risk-reward ratio performs given the Money Meter readings on your preferred pairs and time-frames to build confidence and refine stop/take levels.
Download Now
Download the “Money meter.mq4” indicator for Metatrader 4
FAQ
What makes the Money Meter Forex indicator different from standard indicators?
Unlike trend or momentum indicators, the Money Meter focuses on potential monetary outcomes.
It helps traders judge whether a setup is worth the risk before committing capital.
Can the Money Meter Forex indicator be used alone?
It is best used as a confirmation tool.
Most traders combine it with price action, trend analysis, or support and resistance for better accuracy.
Summary
The Money Meter Forex indicator for Metatrader 4 is a free account management tool built for MT4.
It gives traders an idea of how much money can be made when a trade moves in their favor or lost when it goes against them.
This focus helps improve trade selection and discipline.
Overall, the indicator is easy to use, flexible, and effective as a decision support tool.
With proper integration into a solid trading plan, it can enhance consistency and risk awareness.


