About the Multi Timeframe MTF Trade Analysis Indicator
The Multi Timeframe MTF Trade Analysis Indicator for MT4 is designed to give traders a complete view of trend direction across multiple timeframes from a single chart.
It removes the need to manually switch between charts by analyzing trend conditions automatically.
Once applied to a currency pair, the Indicator evaluates market direction on the 1-minute, 5-minute, 15-minute, 30-minute, 1-hour, 4-hour, daily, and weekly timeframes.
The results are displayed in a dedicated window, showing whether each timeframe is trending up or down.
This Indicator combines several well-known technical tools to form a unified trend decision.
By blending moving averages and momentum indicators, it helps traders focus on the strongest directional setups and avoid mixed or uncertain conditions.
Free Download
Download the “ferrufx-multi-info-indicator.mq4” MT4 indicator
Key Features
- Analyzes multiple timeframes from one chart.
- Displays trend direction as UP or DOWN.
- Uses a combination of trend and momentum indicators.
- Runs in a separate analysis window.
- Reduces the need for manual multi-chart analysis.
- Supports scalping, intraday, and swing trading.
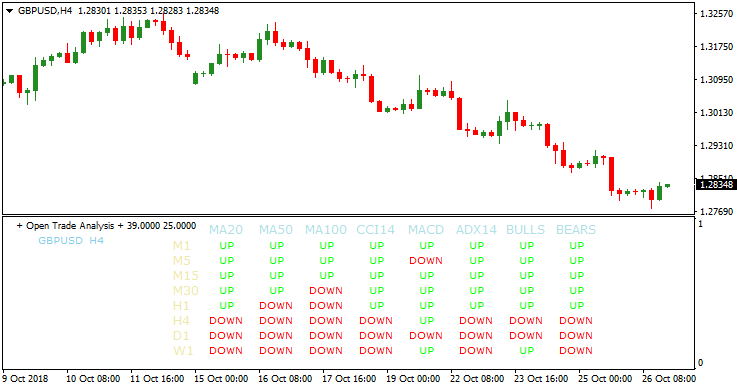
Indicator Chart
The image below shows the Multi Timeframe MTF Trade Analysis Indicator displayed in a separate window below the price chart.
Each row reflects a different timeframe, clearly showing whether market conditions favor bullish or bearish trades.

Guide to Trade with Multi Timeframe MTF Trade Analysis Indicator
Buy Rules
- Select a timeframe showing strong bullish alignment.
- Confirm the trend reads UP across all analyzed indicators.
- Enter a buy trade in the direction of the confirmed trend.
- Focus on timeframes with minimal conflicting signals.
Sell Rules
- Select a timeframe showing strong bearish alignment.
- Confirm the trend reads DOWN across all analyzed indicators.
- Enter a sell trade in the direction of the confirmed trend.
- Avoid trades when trend readings are mixed.
Stop Loss
- Place the stop loss beyond the nearest structural swing point.
- Keep risk proportional to the selected timeframe.
- Reduce position size on higher timeframes if needed.
- Exit early if the trend reading flips direction.
Take Profit
- Close the position when the selected timeframe trend changes.
- Scale out profits as price approaches key levels.
- Use support or resistance as an alternative target.
- Trail profits while trend alignment remains intact.
MT4 Multi Timeframe Analysis + Super Trend Forex Strategy for MT4
This strategy combines the Multi Timeframe MTF Trade Analysis MT4 indicator with the Non-Repainting Super Trend MT4 indicator.
The MTF Trade Analysis checks multiple technical indicators across different timeframes to confirm strong trends.
A consistent “UP” trend across all indicators signals a strong bullish bias, while a consistent “DOWN” trend signals a strong bearish bias.
The Super Trend indicator adds precise entry signals using a blue line for buys and a red line for sells.
By combining trend confirmation with clear entry signals, this strategy is designed for intraday and swing traders who want high-probability trades on major currency pairs.
Buy Rules
- The MTF Trade Analysis must show an “UP” trend across all technical indicators for the selected timeframe.
- The Non-Repainting Super Trend line must turn blue.
- Enter a buy trade at the next candle open after both signals align.
- Place the stop loss below the most recent swing low or below the Super Trend line.
- Take profit at the next resistance level or trail the stop if momentum remains strong.
Sell Rules
- The MTF Trade Analysis must show a “DOWN” trend across all technical indicators for the selected timeframe.
- The Non-Repainting Super Trend line must turn red.
- Enter a sell trade at the next candle open after both signals confirm the trend.
- Place the stop loss above the most recent swing high or above the Super Trend line.
- Take profit at the next support level or trail the stop if the trend continues.
Advantages
- Combines multiple timeframe confirmation with precise entry signals to improve trade accuracy.
- Non-repainting Super Trend ensures signals remain valid after candle close.
- Works well on major currency pairs and various timeframes, from M15 to H1.
Drawbacks
- During sideways or low-volatility markets, signals may lag or fail to trigger.
- High-impact news events can reverse trends quickly and invalidate signals.
Case Study 1. EURUSD Intraday Buy
On EURUSD M15, the MTF Trade Analysis showed a strong “UP” trend across all monitored indicators.
Shortly after, the Super Trend line turned blue.
A buy trade was entered at 1.0970 with a stop loss at 1.0955.
Price climbed steadily and reached the first target at 1.0990 for a 20 pip gain.
Momentum remained strong, so the trade was trailed to 1.1002, capturing an additional 12 pips.
Case Study 2. GBPUSD Afternoon Sell
On GBPUSD H1, the MTF Trade Analysis confirmed a “DOWN” trend across all indicators.
The Super Trend line turned red, signaling a sell entry at 1.2425.
Stop loss was set at 1.2440.
Price moved downward in a steady trend, hitting a first target of 1.2405 for 20 pips.
The move continued to 1.2392 before losing momentum, adding a total of 33 pips.
Strategy Tips
- Prefer M15 to H1 timeframes to balance trade frequency and trend reliability.
- Monitor economic news to avoid sudden reversals during high-impact events.
- Adjust position size according to volatility to manage risk effectively.
- Close trades early if the Super Trend line reverses color before reaching targets.
Download Now
Download the “ferrufx-multi-info-indicator.mq4” Metatrader 4 indicator
FAQ
Which indicators are used in the analysis?
The Indicator evaluates the 20, 50, and 100-period moving averages along with CCI, MACD, ADX, and Bulls and Bears to form its trend decision.
Do all timeframes need to agree?
No. Traders often focus on one or two timeframes with strong alignment rather than waiting for full agreement across all rows.
Is this Indicator suitable for fast trading styles?
Yes. Lower timeframes such as the 1-minute and 5-minute charts are commonly used for scalping when trends are clearly defined.
Can it be combined with price action?
Many traders use it as a directional filter while timing entries using chart patterns, support and resistance, or candlestick behavior.
Summary
The Multi Timeframe MTF Trade Analysis Indicator helps traders evaluate market direction across several timeframes from a single view.
Its trend-based layout simplifies complex analysis into clear directional signals.
By combining multiple technical indicators into one decision per timeframe, it supports disciplined trade selection and reduces conflicting bias.
When paired with solid execution rules, it fits active and higher-timeframe trading approaches alike.


