
About the Pin Bar Detector Indicator
The Pin Bar Detector Indicator for MT5 identifies bullish and bearish pin bars on price charts, helping traders spot potential trend reversals.
Pin bars are single-candle patterns that often signal reversals near key support and resistance zones.
A green pin bar indicates a potential bullish reversal, while a red pin bar signals a possible bearish reversal.
Traders can customize the colors of the up and down pin bars to fit their chart style.
For higher accuracy, the Pin Bar Detector works well when combined with other technical tools, such as the 100 SMA, which helps confirm overall trend direction.
The indicator is suitable for all currency pairs and timeframes.
Free Download
pinbardetector.mq5 Indicator (MT5)
Key Features
- Identifies bullish (green) and bearish (red) pin bars.
- Highlights potential trend reversal points.
- Customizable pin bar colors for up and down candles.
- Works on all timeframes and currency pairs.
- Can be combined with other indicators like the 100 SMA.
- Provides clear entry and exit reference points.
- Helps traders plan stop loss and take profit levels.
Indicator Chart
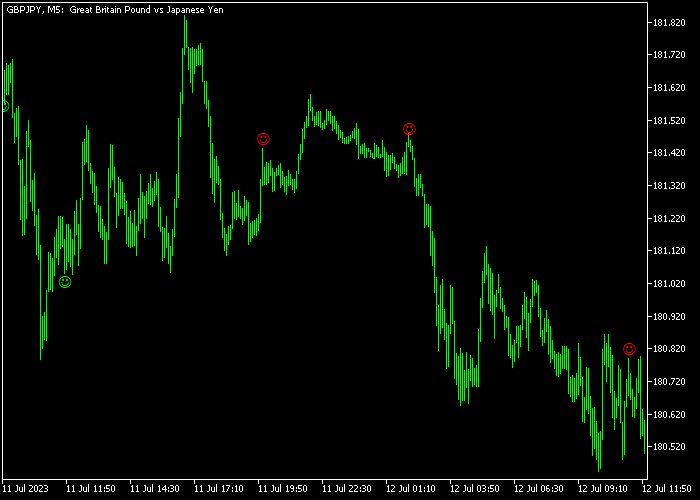
The Pin Bar Detector Indicator appears in the main price window, marking bullish pin bars in green and bearish pin bars in red.
Traders watch for pin bar formations near key support and resistance zones.
By adding the 100 SMA, traders can confirm the overall trend: enter long trades with bullish pin bars above the SMA and short trades with bearish pin bars below the SMA.
This combination improves trend-following accuracy.
Guide to Trade with Pin Bar Detector Indicator
Buy Rules
- Wait for a green pin bar to appear near support levels.
- Confirm overall bullish trend using the 100 SMA.
- Enter a buy market order after the pin bar closes.
- Trade in alignment with short-term upward momentum.
Sell Rules
- Wait for a red pin bar to appear near resistance levels.
- Confirm overall bearish trend using the 100 SMA.
- Enter a sell market order after the pin bar closes.
- Trade in alignment with short-term downward momentum.
Stop Loss
- Place the stop loss below the pin bar low for buy trades.
- Place the stop loss above the pin bar high for sell trades.
- Keep stops slightly beyond support or resistance to reduce false triggers.
Take Profit
- Close buy trades near the next resistance level or a preferred pip target.
- Close sell trades near the next support level or a preferred pip target.
- Alternatively, use your own take profit strategy based on price action.
Pin Bar Detector and Vortex Trend Indicator Day Trading Strategy for MT5
This strategy combines pattern-based entry signals with trend confirmation.
It uses the Pin Bar Detector MT5 to spot high‑probability reversal candlesticks, while the Vortex Trend Indicator MT5 confirms the strength and direction of the trend with a colored histogram.
Focusing on pin bar signals that match the Vortex trend reduces false entries and allows traders to catch cleaner price moves.
This approach is ideal for day trading on M5, M15, and H1 timeframes.
Buy Entry Rules
- Wait for the Vortex Trend Indicator to show a green histogram, indicating bullish trend bias.
- Look for a green pin bar as the entry signal.
- Enter a buy trade at the opening of the next candle after the green pin bar forms.
- Place stop loss below the low of the pin bar or recent swing low for risk control.
- Take profit at the next significant resistance area or when the Vortex Trend histogram turns red.
Sell Entry Rules
- Wait for the Vortex Trend Indicator to show a red histogram, indicating bearish trend bias.
- Look for a red pin bar as the entry signal.
- Enter a sell trade at the opening of the next candle after the red pin bar forms.
- Place a stop loss above the high of the pin bar or recent swing high for risk control.
- Take profit at the next key support area or when the Vortex Trend histogram turns green.
Case Study 1
On EURUSD M15, the Vortex Trend Indicator showed a green histogram, signaling a bullish trend bias.
During a pullback, the Pin Bar Detector printed a green pin bar representing rejection of lower prices.
A buy trade was placed at the next candle open. Stop loss was placed just below the pin bar low.
Price resumed upward with strong momentum and hit the next nearby resistance.
The trade was closed when the Vortex histogram turned red, suggesting weakening bullish momentum.
Case Study 2
On GBPUSD M5, the Vortex Trend Indicator showed a red histogram, confirming bearish trend bias.
After a brief consolidation, a red pin bar formed, signaling bearish rejection.
A sell trade was opened at the next candle. Stop loss was set above the pin bar high.
Price dropped quickly with strong selling pressure and reached a key support area.
The position was closed for 27 pips when the histogram turned green, signaling potential slowing of the bearish move.
Download Now
pinbardetector.mq5 Indicator (MT5)
FAQ
Can this indicator be used on any timeframe?
Yes. The Pin Bar Detector works on all timeframes, but larger timeframes tend to produce more reliable reversal signals.
Should I trade every pin bar signal?
No. Wait for confirmation from the 100 SMA or other trend indicators to reduce false signals.
Can the pin bar colors be customized?
Yes. Traders can set their preferred colors for bullish (up) and bearish (down) pin bars for better chart visibility.
Summary
The Pin Bar Detector Indicator provides a simple and effective way to spot bullish and bearish reversal opportunities on any chart.
By combining pin bars with the 100 SMA for trend confirmation, traders can improve entry accuracy and manage risk with clear stop loss and take profit levels.
For intraday and swing traders looking for high-probability reversals, this indicator offers a practical, visually clear, and customizable solution.


