
About the Precise Forex Trend Reversal Indicator
As the name suggests, the Precise Forex Trend Reversal for Metatrader 4 identifies the best possible trend reversal signals before the real move occurs.
This indicator operates by calculating the exhaustion levels of a current trend and pinpointing the exact moment momentum shifts in the opposite direction.
It uses a dual-line calculation that smooths out price noise, allowing you to see the underlying trend change without the distractions of minor market fluctuations.
It is designed to capture the very beginning of a new market cycle, which is often where the highest risk-to-reward ratios are found.
By integrating this into your chart, you can gain a clearer perspective on when a trend has truly run its course and when a new directional move is likely to materialize.
Free Download
Download the “Trend reversal.ex4” indicator for MT4
Key Features
- Pinpoints potential market tops and bottoms using a sophisticated momentum-tracking algorithm.
- The crossover system provides objective entry points that are easy to identify in real-time.
- Can be used to identify trend exhaustion, helping you exit current trades at the optimal time.
- Clean visual interface with blue and red signal lines for intuitive market analysis.
Indicator Chart
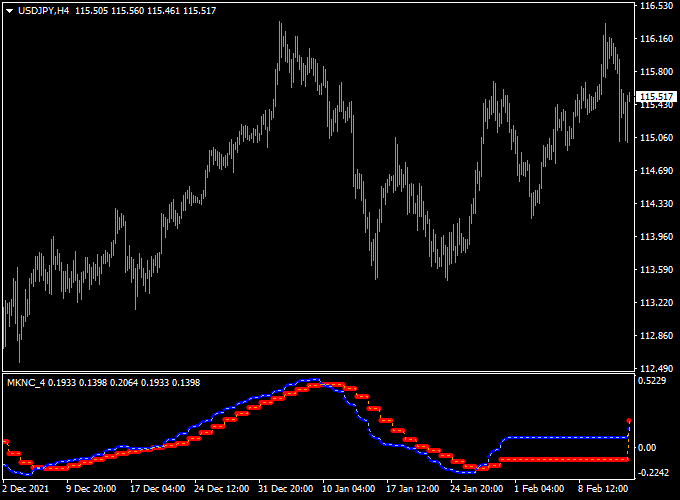
The chart illustrates the Precise Forex Trend Reversal indicator catching several significant shifts in price direction.
You can observe how the blue and red signal lines interact; as they cross, they signal a change in the dominant market force.
This setup allows you to visualize the transition from a bullish phase to a bearish phase with high accuracy.
Guide to Trade with Precise Forex Trend Reversal Indicator
To maximize the success of this indicator, look for crossovers that occur near major support or resistance zones.
Buy Rules
- Open a buy trade when the blue signal line crosses the red signal line bottom-up.
- Ensure the crossover is clear and the lines are starting to diverge upward.
Sell Rules
- Open a sell trade when the blue signal line crosses the red signal line top-down.
- Look for the crossover to occur after a period of price exhaustion for better results.
Stop Loss
- For buy positions, place the stop loss 3 pips below the most recent swing low.
- For sell positions, place the stop loss 3 pips above the most recent swing high.
Take Profit
- Exit the trade when the signal lines cross back in the opposite direction.
- Target the next significant intraday support or resistance level.
Trend Reversal Signal + Histogram Momentum Forex Scalping MT4 Strategy
This scalping strategy blends the precise crossover signals from the Trend Reversal Indicator with momentum confirmation from the Histogram‑based Scalping Indicator.
The idea is to enter short‑term trades when the trend reversal indicator signals a shift and the histogram confirms the momentum direction.
The approach suits traders who actively watch the markets and want systematic, high‑frequency entries rather than longer holds.
Buy Entry Rules
- Wait for the blue signal line of the Trend Reversal Indicator to cross above the red signal line (bottom‑up crossover).
- Confirm that the Scalping Indicator’s histogram turns green, indicating bullish momentum.
- Open a buy trade when both these conditions align.
- Stop loss: Place a few pips below the recent swing low or support level.
- Take profit: set at 1.5× the stop loss or exit when the histogram turns red or the crossover reverses.
Sell Entry Rules
- Wait for the blue signal line of the Trend Reversal Indicator to cross below the red signal line (top‑down crossover).
- Confirm that the Scalping Indicator’s histogram turns red, indicating bearish momentum.
- Open a sell trade when both conditions align.
- Stop loss: place a few pips above the recent swing high or resistance level.
- Take profit: set at 1.5× the stop loss or exit when the histogram turns green or the crossover reverses.
Advantages
- Combines trend‑reversal signals (crossover) with momentum confirmation (histogram) for higher‑probability scalps.
- Short time‑frame use (5‑min / 15‑min) gives multiple opportunities within a session.
- Systematic entry and exit rules reduce emotional trading and help follow discipline.
Drawbacks
- It may produce false signals during sideways or very choppy markets where reversals are weak.
- Exits based purely on histogram or crossover reversal may sometimes trigger early in strong trending moves.
Case Studies
Case Study 1: EUR/USD 5‑Minute Chart
The blue signal line crossed above the red line, signaling a potential trend reversal upward.
The histogram then turned green, confirming bullish momentum.
A buy trade was opened at 1.1040 with a stop loss 10 pips below the swing low and a take‑profit at 15 pips (1.5× risk).
Price moved quickly upward and hit the target in under an hour.
Case Study 2: GBP/AUD 15‑Minute Chart
The blue signal line crossed downward below the red line, suggesting a trend shift downward.
The histogram turned red, confirming momentum.
A sell trade was opened at ~1.8600 with a stop loss 12 pips above the recent swing high and take‑profit set at 18 pips.
Price slid gradually and reached the target over a couple of hours, showing a real‑world example of the crossover + histogram alignment producing a strong short‑term move.
Strategy Tips
- Use 5‑minute or 15‑minute charts for entry and exit timing; higher timeframes may reduce scalping frequency.
- Only trade when both indicators align (crossover + histogram) — avoid trading one without the other.
- Avoid taking trades just before major news events unless you’re experienced with volatility spikes.
Download Now
Download the “Trend reversal.ex4” indicator for Metatrader 4
FAQ
Does this indicator work better on specific timeframes?
While it works on all timeframes, the H1 and H4 charts typically provide the most reliable reversal signals.
On these higher timeframes, the crossovers represent significant shifts in market sentiment that are less likely to be affected by short-term market noise.
How do I filter out false signals in a flat market?
In a ranging or flat market, the signal lines may cross frequently.
To filter these out, avoid trading when the lines are moving horizontally and very close to each other.
Wait for a crossover where the lines show a clear angle and separation.
Is this indicator compatible with other oscillators like the RSI?
Absolutely. Using this tool alongside the RSI can provide excellent confluence.
For example, a bullish crossover that occurs while the RSI is in oversold territory can be a very high-probability reversal signal.
Summary
The Precise Forex Trend Reversal indicator for Metatrader 4 identifies the best possible trend reversal signals before the real move occurs.
This is achieved through a responsive crossover system that monitors the relationship between the blue and red signal lines.
The indicator can be used as a standalone trading tool for both trade entry and exit, or as a filter to confirm reversals within a broader system.
By providing clear, non-repainting signals at market turning points, it helps you enter trades with greater confidence and precision.


