
About the Quantile Bands Indicator
The Quantile Bands Indicator for MT5 is a dynamic trend tool designed to anticipate potential market direction using statistical price distribution levels.
It plots an upper band, middle band, and lower band directly on the price window. The middle band changes color to reflect market conditions.
Green signals bullish momentum. Orange signals bearish momentum. Gray suggests a sideways phase.
The calculation relies on a quantile period combined with a high/low lookback. This allows the bands to adapt to changing volatility.
Traders can adjust the quantile period and band percentages to match their trading style.
The indicator works effectively as a standalone system.
It provides directional bias and practical entry timing without requiring additional tools.
Free Download
Quantile_bands_-_generalized.mq5 Indicator (MT5)
Key Features
- Upper, middle, and lower quantile-based bands plotted in the main price window.
- Color-changing middle line to define bullish, bearish, and ranging conditions.
- Adjustable quantile period for sensitivity control.
- Customizable upper, middle, and lower band percentages.
- High/low lookback parameter for refined band placement.
- Works as a standalone trend and signal indicator.
- Lightweight and suitable for multiple timeframes.
Indicator Chart
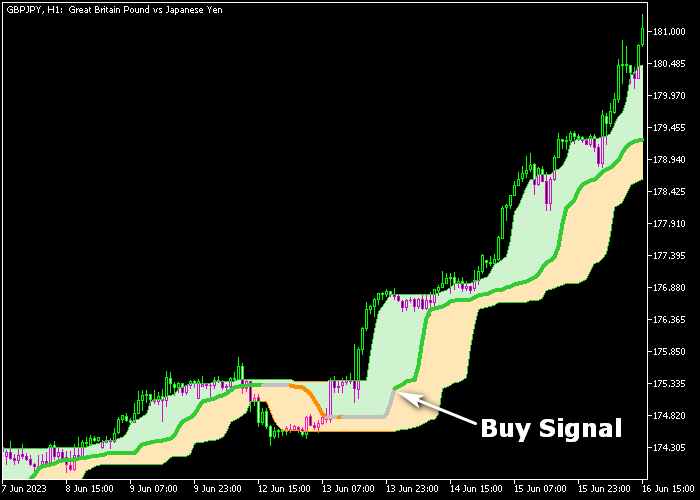
The Quantile Bands Indicator displays three adaptive bands around the price.
The middle line shifts between green, orange, and gray to reflect active trend conditions.
Buy opportunities appear when the middle band turns green and price reacts above the lower band.
Sell opportunities develop when the line turns orange and price respects the upper band.
Gray signals advise patience during consolidation.
Guide to Trade with Quantile Bands Indicator
Buy Rules
- Wait for the middle Quantile Bands line to turn green.
- Confirm price is holding above the lower band.
- Enter a buy market order after bullish confirmation.
- Ensure overall market momentum supports upward continuation.
Sell Rules
- Wait for the middle Quantile Bands line to turn orange.
- Confirm price is holding below the upper band.
- Enter a sell market order after bearish confirmation.
- Ensure downside pressure is visible before committing.
Stop Loss
- For buy trades, place the stop loss below the lower Quantile Band.
- For sell trades, place the stop loss above the upper Quantile Band.
- Never widen the stop once the trade is active.
Take Profit
- Close buy trades when the middle line turns orange.
- Close sell trades when the middle line turns green.
- Alternatively, target the opposite Quantile Band as a price objective.
- Maintain a healthy minimum risk to reward ratio of 1.5 to 1.
Quantile Bands MT5 Breakout Strategy with Auto Trend Lines Indicator
This breakout strategy blends the Quantile Bands Forex Indicator with the Auto Trend Lines Indicator to capture directional moves as price breaks key dynamic levels.
It focuses on combining trend direction from the bands with breakout signals from the trend lines to time entries with higher confidence.
The Quantile Bands indicator shows a coloured line that reflects prevailing momentum.
A green band indicates bullish conditions, while an orange band shows bearish pressure.
These bands help define the general environment before taking a breakout trade.
The Auto Trend Lines indicator automatically draws trend lines that act as dynamic support and resistance.
A close above the blue upper trend line signals a buy breakout, while a close below the red lower trend line signals a sell breakout.
This strategy works best on M15 and H1 charts during the London and New York sessions when breakouts tend to be more reliable.
Buy Entry Rules
- Confirm that the Quantile Bands line is green, indicating bullish bias.
- Wait for price to close above the blue trend line of the Auto Trend Lines indicator.
- Enter a buy trade at the opening of the next candle.
- Place the stop loss below the breakout zone or recent swing low.
- Take profit near a measured target based on recent volatility or when the Quantile Bands turn orange.
Sell Entry Rules
- Confirm that the Quantile Bands line is orange, indicating bearish bias.
- Wait for price to close below the red lower trend line of the Auto Trend Lines indicator.
- Enter a sell trade at the opening of the next candle.
- Place a stop loss above the breakout zone or recent swing high.
- Take profit near a key support area or when the Quantile Bands turn green.
Case Study 1: EURAUD M15 Bullish Breakout
On EURAUD M15 during the London session, the Quantile Bands line remained green, showing that buyers were in control.
Price entered a consolidation range with a clearly defined blue trend line on top.
When price closed above that blue line, it signaled a breakout to the upside with follow‑through pressure.
A buy trade was opened at the next candle. The stop loss was placed below the breakout level just under the recent swing low.
Price continued higher with clean candles.
The trade was monitored until the Quantile Bands line began to flatten and shift toward orange, suggesting a potential slowdown in bullish momentum, at which point the position was exited.
Case Study 2: USDJPY H1 Bearish Breakout
On USDJPY H1 during the New York session, the Quantile Bands line turned orange after price failed to make higher highs.
Price moved sideways against a red lower trend line.
When price closed below the red trend line, it signaled a breakout to the downside with increased selling pressure.
A sell trade was entered at the next candle. The stop loss was placed above the breakout area near the swing high.
Price continued lower in follow‑through selling.
The short position was closed for 57 pips when price approached a key support zone and the Quantile Bands line started to show signs of turning green, indicating that bearish momentum was easing.
Download Now
Quantile_bands_-_generalized.mq5 Indicator (MT5)
FAQ
Can the Quantile Bands Indicator be used without other tools?
Yes. The indicator provides both directional bias and entry timing through its band placement and color-changing middle line.
Many traders use it as a complete system, especially on higher timeframes.
What does the gray middle line mean?
The gray color indicates a sideways market phase.
During this period, price lacks strong directional pressure. It is often better to wait for a green or orange shift before entering new trades.
Which settings should I adjust first?
The quantile period is the primary sensitivity control. A lower value increases responsiveness but may create more frequent signals.
The band percentage inputs fine-tune how tightly price interacts with the bands.
Summary
The Quantile Bands Indicator for MT5 offers a disciplined way to follow trend shifts using statistical band positioning.
The color-coded middle line simplifies trading decisions while the outer bands define logical risk areas.
Its adjustable inputs allow traders to tailor sensitivity to scalping, intraday, or swing trading.
It performs strongly as a standalone tool, yet can also complement price action analysis.
With proper testing and risk management, it can become a reliable part of a forex trading plan.


