The binary Rainbow Oscillator indicator for Metatrader 5 transforms the classic trend rainbow into a binary Forex signal indicator.
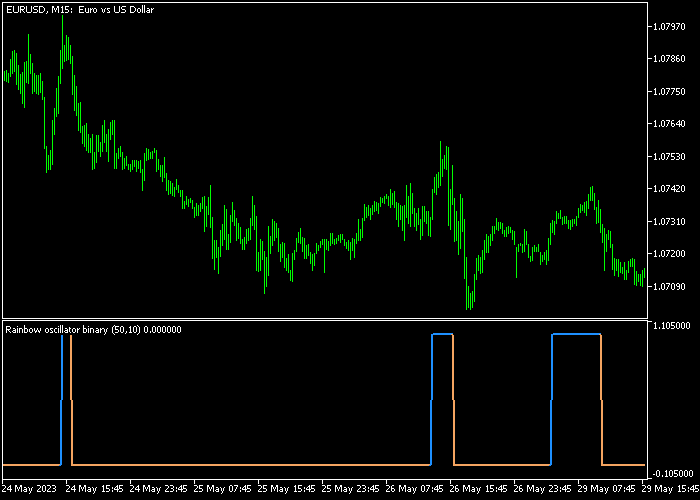
The indicator appears in a bottom chart as a blue and brown colored signal line.
The binary Rainbow indicator uses two binary values to determine the buying and selling state:
- The 1.1050 binary value creates a buy signal (blue line).
- The -1.1050 binary value creates a sell signal (brown line).
The indicator can be used as a standalone technical tool or together with price action strategies.
The following indicator inputs and parameters can be modified: period, RWMA depth (maximal 50), price, and colors.
Please make yourself familiar with this technical indicator and test it first on a demo account.
It supports all time frames and Forex pairs.
Download Indicator 🆓
Ranbow oscillator – binary.mq5 Indicator (MT5)
Chart Example
The following chart shows what the Binary Rainbow Oscillator indicator looks like when applied to the MT5 chart.

How To Buy And Sell Forex Pairs With The Rainbow Oscillator Binary Signal Indicator?
Find a simple trading example below:
Buy Signal
- A buy trade occurs when the blue line is displayed in the chart.
- Open a buy trade and place your stop loss below technical support.
- Reverse the buy trade when a sell signal is displayed in the chart.
Sell Signal
- A sell trade occurs when the brown line is displayed in the chart.
- Open a sell trade and place your stop loss above technical support.
- Reverse the sell trade when a buy signal is displayed in the chart.
Download Now 🆓
Ranbow oscillator – binary.mq5 Indicator (MT5)
Frequently Asked Questions
How Do I Install This Custom Indicator On Metatrader 5?
- Open the MT5 trading platform
- Click on the File menu button located at the top left part of the platform
- Click on Open Data Folder > MQL5 folder > Indicators
- Copy the Ranbow oscillator – binary.mq5 indicator file in the Indicators folder
- Close and restart the trading platform
- You will find the indicator here (Navigator window > Indicators)
- Drag the indicator to the chart to get started with it!
How Do I Edit This Indicator?
- Click in the open chart with your right mouse button
- In the dropdown menu, click on Indicator List
- Select the indicator and click on properties
- Now you can edit the inputs, colors, levels, scale and visualization
- Finally click the OK button to save the new configuration


