
About the RSI MA Indicator
The RSI MA indicator for MT5 is a simple buy/sell system that combines the Relative Strength Index with moving averages to identify trend exhaustion points.
It highlights potential reversal areas, helping users enter trades with lower risk and higher profit potential.
A blue arrow signals a potential bullish reversal, while a red arrow signals a bearish reversal.
All parameters, including RSI period, RSI levels, MA buy period, and MA sell period, can be fully customized to suit different strategies and timeframes.
Free Download
Rsi ma ind mt5.mq5 Indicator (MT5)
Key Features
- Combines RSI and moving averages for trend reversal signals.
- Displays clear buy (blue) and sell (red) arrows on the chart.
- Helps identify low-risk entry points with potential for high reward.
- Customizable RSI periods and levels for fine-tuning signals.
- Adjustable moving average periods for buy and sell setups.
- Suitable for multiple timeframes.
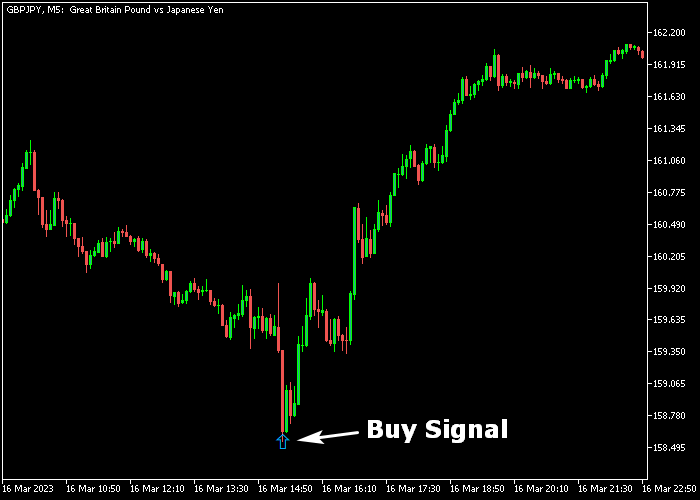
Indicator Chart
The RSI MA indicator appears directly on the main price chart. Blue arrows indicate potential bullish reversals, while red arrows mark bearish reversals.
These arrows provide clear entry points without needing additional analysis tools.
Guide to Trade with RSI MA Indicator
Buy Rules
- Wait for a blue arrow to appear on the chart.
- Confirm that the recent trend shows signs of exhaustion.
- Enter a buy position after the blue arrow forms.
- Observe price action to validate the upward momentum.
Sell Rules
- Wait for a red arrow to appear on the chart.
- Check that the prior trend is showing signs of slowing down.
- Enter a sell position after the red arrow forms.
- Monitor price movement to confirm bearish momentum.
Stop Loss
- For buy trades, place the stop loss a few pips below the most recent swing low.
- For sell trades, set the stop loss a few pips above the most recent swing high.
Take Profit
- Close the trade when the next opposite arrow appears.
- Another option is targeting a risk-to-reward ratio of at least 2.0.
- Exit early if price action indicates the trend is reversing.
Download Now
Rsi ma ind mt5.mq5 Indicator (MT5)
FAQ
How does the RSI MA indicator generate signals?
The indicator combines RSI levels with moving averages to detect trend exhaustion.
Blue arrows indicate potential bullish reversals, and red arrows indicate potential bearish reversals.
Can the input settings be adjusted?
Yes. Users can change the RSI period, RSI levels, MA buy period, and MA sell period to fine-tune signal sensitivity.
Which instruments and timeframes are supported?
The indicator works on any forex pair or instrument on MT5 and can be applied across multiple timeframes for different trading styles.
How should stop loss and take profit be set?
Stop loss should be placed beyond the nearest swing high/low, while take profit can follow the next signal arrow or a predefined risk-to-reward ratio.
Summary
The RSI MA indicator simplifies trend reversal detection by combining RSI and moving averages into clear, actionable arrows.
Its customizable parameters allow adaptation to different instruments and timeframes.
Using dedicated stop loss and take profit levels with the signal arrows helps manage risk effectively while maximizing potential profits.
This makes the indicator a practical tool for spotting trend reversals with minimal confusion.


