The RSI With NET indicator for Metatrader 5 is a Forex scalper that provides multiple profitable trading signals a day for 5-15 pips profit.
The indicator appears in a bottom chart as two colored lines (RSI + NET) that create a typical crossover trading system.
A bullish or bearish trend is easy to spot with this indicator:
- A bullish trend occurs when the blue RSI line crosses over the gray NET line.
- A bearish trend occurs when the blue RSI line crosses below the gray NET line.
This indicator works best on the lower spread pairs for maximum profit (EUR/USD, GBP/USD, etc).
The following indicator inputs can be modified: RSI period, NET period, and price.
First, familiarize yourself with this technical indicator and test it on a demo account.
It supports all time frames and Forex pairs.
Download Indicator 🆓
MyRsi with NET.mq5 Indicator (MT5)
Chart Example
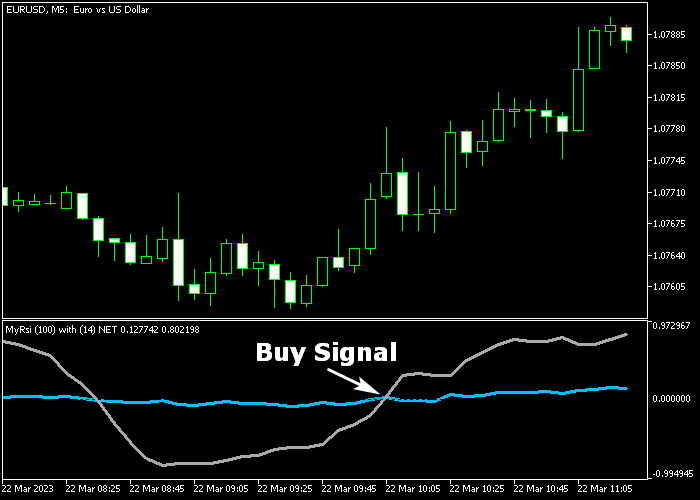
The following chart shows how the RSI With NET Forex scalper indicator looks like when applied to the MT5 chart.

How To Buy And Sell Forex Pairs With The RSI With NET Scalper Indicator?
Find a simple trading example below:
Buy Signal
- A buy signal is given when the blue RSI line crosses the gray NET line bottom-up.
- Open a buy transaction and place a stop loss below short-term support.
- Close the buy trade for 5-15 pips profit (depends on the chosen time frame).
Sell Signal
- A sell signal is given when the blue RSI line crosses the gray NET line top-down.
- Open a sell transaction and place a stop loss above short-term resistance.
- Close the sell trade for 5-15 pips profit (depends on the chosen time frame).
Download Now 🆓
MyRsi with NET.mq5 Indicator (MT5)
Frequently Asked Questions
How Do I Install This Custom Indicator On Metatrader 5?
- Open the MT5 trading platform
- Click on the File menu button located at the top left part of the platform
- Click on Open Data Folder > MQL5 folder > Indicators
- Copy the MyRsi with NET.mq5 indicator file in the Indicators folder
- Close and restart the trading platform
- You will find the indicator here (Navigator window > Indicators)
- Drag the indicator to the chart to get started with it!
How Do I Edit This Indicator?
- Click in the open chart with your right mouse button
- In the dropdown menu, click on Indicator List
- Select the indicator and click on properties
- Now you can edit the inputs, colors, levels, scale and visualization
- Finally click the OK button to save the new configuration


