
About the Smoothed Hull Moving Average (HMA) indicator
The Smoothed Hull Moving Average indicator for MT4 is an enhanced version of the classic HMA, designed to provide faster and smoother trend signals.
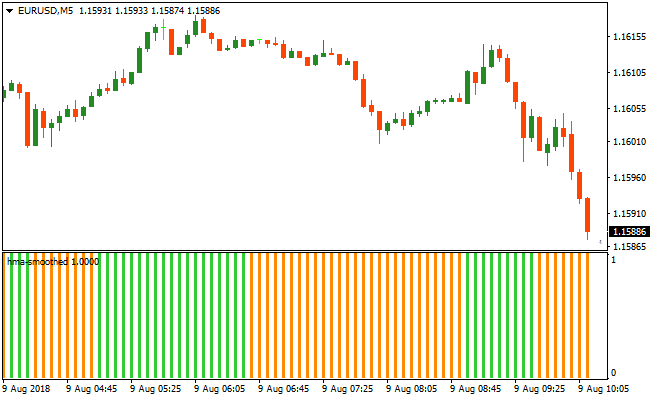
It displays green and orange histogram bars in a separate window below the main chart, making it easy to spot buy and sell opportunities.
Green bars indicate potential long positions, while orange bars indicate potential short positions.
For best results, use the Smoothed HMA in combination with a trend-following tool, such as a 200-period moving average, to trade only in the direction of the overall trend.
Free Download
Download the “hma-smoothed.mq4” MT4 indicator
Key Features
- Displays smoothed HMA histogram bars for buy (green) and sell (orange) signals.
- Helps traders quickly identify short-term trend shifts.
- Pairs well with trend-following indicators for higher-probability trades.
- Provides a clean and easy-to-read visual signal window below the price chart.
Indicator Chart
Green bars signal short-term bullish momentum and potential buy entries, while orange bars signal short-term bearish momentum and potential sell entries.
Traders can immediately see trend direction and time their entries and exits according to the histogram changes.
The indicator helps align trades with the prevailing trend and simplifies decision-making for all trading styles.
Guide to Trade with Smoothed HMA
Buy Rules
- Trade only when the overall trend is up, such as above a 200-period moving average.
- Open a long position after the first green HMA histogram bar forms.
- Confirm that the green bar is not part of a small counter-trend pullback.
Sell Rules
- Trade only when the overall trend is down, such as below a 200-period moving average.
- Open a short position after the first orange HMA histogram bar forms.
- Confirm that the orange bar is not part of a temporary counter-trend spike.
Stop Loss
- For buy trades, place a stop loss just below the most recent minor swing low.
- For sell trades, place a stop loss just above the most recent minor swing high.
- Consider using the Average True Range (ATR) to dynamically adjust stop distance based on current market volatility.
Take Profit
- Close trades when two consecutive histogram bars of the opposite color appear, signaling a potential momentum shift.
- Set partial take profit near recent support levels for buys and resistance levels for sells.
- Alternatively, target a fixed risk-reward ratio, such as 1:2 or 1:3, depending on your trading plan and volatility.
Smoothed HMA and Vulkan Profit MT4 Scalping Strategy
This MT4 scalping strategy combines the Smoothed Hull Moving Average HMA Indicator with the Vulkan Profit Forex Indicator to create a trend‑aligned, momentum‑filtered system for short‑term trades.
The Smoothed HMA indicator shows trend direction through its histogram colors, while the Vulkan Profit indicator prints blue and red arrows for precise entry signals.
By trading only when both indicators align, you can catch quick movements while reducing false entries.
This strategy is best for M1, M5, and M15 charts and works well on major and liquid cross currency pairs.
It focuses on entering trades with strong trend momentum confirmed by histogram direction and a signal arrow, improving scalping accuracy.
Buy Entry Rules
- The Smoothed HMA histogram bars are green, showing bullish momentum.
- The Vulkan Profit indicator prints a blue arrow.
- Enter a buy trade at the close of the candle with the blue arrow.
- Place the stop loss below the most recent swing low or below the latest green histogram bar.
- Exit the trade when the histogram turns orange or when a red arrow appears.
Sell Entry Rules
- The Smoothed HMA histogram bars are orange, showing bearish momentum.
- The Vulkan Profit indicator prints a red arrow.
- Enter a sell trade at the close of the candle with the red arrow.
- Place the stop loss above the most recent swing high or above the latest orange histogram bar.
- Exit the trade when the histogram turns green or when a blue arrow appears.
Advantages
- Combines trend direction and signal confirmation for better entry timing.
- Visual histogram bars and arrows make it easy to spot scalping setups quickly.
- Adaptable to multiple short time frames including M1, M5, and M15.
- Helps avoid countertrend entries by requiring alignment of both indicators.
- Works well on major pairs with strong intraday moves.
- Clear exit signals reduce guesswork during trade management.
Drawbacks
- Scalping requires active monitoring and quick execution.
- Spread and slippage can reduce net gains on fast moves.
- Noise on very short time frames may trigger early exits.
- Less effective outside major session hours with lower liquidity.
Case Study 1
On GBPUSD M5 during the London session, the Smoothed HMA histogram turned green showing bullish momentum.
Shortly after, the Vulkan Profit indicator printed a blue arrow.
A buy trade was opened at candle close with the stop loss below the recent swing low.
Price moved higher with momentum and the trade gained 15 pips before the histogram turned orange, signaling exit.
Case Study 2
On AUDUSD M1 in the early New York session, the Smoothed HMA histogram was orange showing bearish momentum.
The Vulkan Profit indicator then printed a red arrow.
A sell trade was opened at the close of the signal candle with the stop loss above the recent swing high.
Price continued down and the trade gained 10 pips before the histogram flipped green, signaling exit.
Strategy Tips
- Only enter trades when both the histogram and signal arrow are aligned in the same direction.
- Focus on major and high‑liquidity pairs to reduce noise and improve execution.
- Use recent swing highs and lows for logical stop placement rather than fixed pip values.
- Monitor spread conditions, especially on M1 charts, to protect profit potential.
- Review the higher timeframe trend to align scalping direction with broader market flow.
- Limit trades during quiet market sessions to avoid noise‑based signals.
Download Now
Download the “hma-smoothed.mq4” Metatrader 4 indicator
FAQ
Do I need another indicator to trade effectively?
It is recommended to combine the Smoothed HMA with a trend-following indicator, such as a 200-period moving average, to trade only in the direction of the main trend.
How should I interpret green and orange bars?
Green bars indicate potential long entries, while orange bars indicate potential short entries. Always align signals with the overall trend.
Is it beginner-friendly?
Yes, the histogram provides clear buy and sell signals, making it easy for beginners to follow trends and enter trades confidently.
Summary
The Smoothed Hull Moving Average indicator simplifies trend-following by providing green and orange histogram bars that highlight short-term momentum shifts.
By trading only in the direction of the overall trend, traders can enter high-probability buy and sell positions.
With proper stop loss, take profit, and position sizing strategies, the Smoothed HMA helps traders manage risk while capturing strong trend moves efficiently.


