
About the Vulkan Profit Indicator
Vulkan Profit is a complete Forex trading indicator developed for MetaTrader 4 that delivers direct buy and sell signals on the chart.
It is designed to help traders identify market trends and entry points without complex analysis.
The indicator works by analyzing price behavior and trend conditions, then marking potential trade opportunities with arrows.
A blue arrow signals a possible buy setup, while a red arrow indicates a potential sell setup.
These signals are placed directly on the chart, allowing traders to react quickly to changing market conditions.
Vulkan Profit can be used as a standalone trading solution for both entries and exits.
It also integrates smoothly with existing strategies, acting as a confirmation tool for trend direction or timing.
Free Download
Download the “Vulkan Profit.ex4” indicator for MT4
Key Features
- Provides automatic buy and sell arrow signals.
- Designed for use on any currency pair.
- Can be used as a standalone trading system.
- Supports trend identification and trade timing.
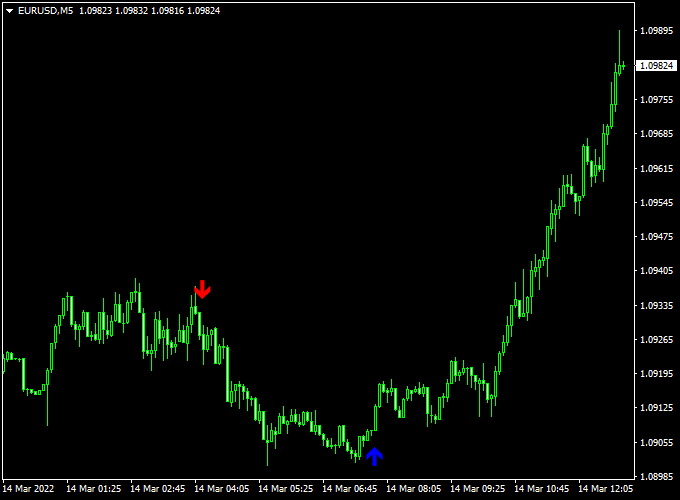
Indicator Chart
The chart below shows the Vulkan Profit indicator applied to a live Forex chart.
Blue arrows highlight potential buy opportunities, while red arrows mark potential sell setups.
These arrows align with prevailing market trends and help traders stay focused on high-probability trades.
Guide to Trade with Vulkan Profit
Buy Rules
- Wait for a blue arrow to appear on the chart.
- Confirm price is not near major resistance.
- Enter a buy trade at the close of the signal candle.
Sell Rules
- Wait for a red arrow to appear on the chart.
- Confirm price is not near major support.
- Enter a sell trade at the close of the signal candle.
Stop Loss
- Set the stop loss a fixed number of pips based on the trading timeframe.
- Use smaller stops on lower timeframes and wider stops on higher timeframes.
- Move the stop loss to break-even once price reaches the first profit objective.
Take Profit
- Set take profit at the next key support or resistance level.
- Use a fixed risk-to-reward ratio such as 1:2 or higher.
- Close the trade early if an opposite arrow appears.
Vulkan Profit + Kijun Candles MT4 Forex Strategy
This Forex trading strategy combines the power of the Vulkan Profit Forex Indicator for MT4 and the Kijun Candles Trend Indicator for MT4 to deliver high-probability entries based on momentum and trend confirmation.
The Vulkan Profit indicator detects precise turning points with colored arrows, while the Kijun Candles indicator visualizes the dominant market direction using color-coded candles.
Together, they form a clear and disciplined strategy suitable for both new and experienced traders.
This method is best applied to timeframes such as M15, M30, and H1, where trends are strong and false signals are minimized.
Traders can apply it across various pairs, including EUR/JPY, GBP/USD, and AUD/CHF.
The goal is to trade in the direction of the trend, entering when both indicators agree on the same signal and exiting when the opposite signal appears.
Buy Entry Rules
- Wait for a blue arrow to appear on the Vulkan Profit indicator, signaling a potential upward reversal.
- Confirm that the Kijun Candles are also blue, indicating a bullish trend phase.
- Enter a buy trade at the close of the blue arrow candle.
- Set a stop loss below the most recent swing low or 25 pips below entry, whichever is larger.
- Take profit when a red arrow appears on the Vulkan Profit indicator or when Kijun Candles turn red.
Sell Entry Rules
- Wait for a red arrow to appear on the Vulkan Profit indicator, signaling a potential downward reversal.
- Confirm that the Kijun Candles are also red, showing bearish momentum.
- Enter a sell trade at the close of the red arrow candle.
- Set a stop loss above the previous swing high or 25 pips above the entry.
- Take profit when a blue arrow appears or when candles turn blue again.
Advantages
- Combines reversal and trend confirmation for strong accuracy.
- Easy to follow visually, perfect for beginner traders.
- Works well in both trending and semi-trending markets.
- Generates clear and timely entries with visual signals.
Drawbacks
- May produce false entries during highly volatile sessions.
- Best avoided during consolidation or sideways market conditions.
Case Study 1 – EUR/JPY (M30 Chart)
On the EUR/JPY M30 chart, a blue arrow from the Vulkan Profit indicator appeared near 162.40.
The Kijun Candles immediately turned blue, confirming a new bullish phase.
A buy order was placed at 162.45 with a 25-pip stop loss.
Within the next few hours, the pair climbed to 163.10, producing a solid +65-pip profit.
Case Study 2 – AUD/CHF (H1 Chart)
On the AUD/CHF hourly chart, a red arrow appeared from the Vulkan Profit indicator around 0.5880.
The Kijun Candles also turned red at the same time, confirming bearish sentiment.
A short trade was opened at 0.5875 with a 20-pip stop loss.
The price dropped steadily to 0.5840 before any sign of reversal, resulting in a +35-pip profit.
This setup showed how the combination can effectively capture medium-term pullbacks.
Strategy Tips
- Use this strategy during active sessions like London and New York to catch strong momentum moves.
- Avoid trading when candles frequently switch between blue and red, as this indicates market indecision.
- For stronger signals, trade only when both indicators align on the same candle close.
- Use a trailing stop after reaching +30 pips to lock in profits during extended trends.
- Combine with a volatility filter or a moving average for additional trend confirmation.
Download Now
Download the “Vulkan Profit.ex4” indicator for Metatrader 4
FAQ
Does Vulkan Profit generate signals in ranging markets?
The indicator may produce signals during sideways conditions.
Filtering trades with a higher timeframe trend direction can improve performance.
Can Vulkan Profit be used for intraday trading?
Yes, the indicator works well on lower timeframes such as M15 and M30.
Intraday traders should monitor news-related volatility.
Are the arrow signals delayed?
Signals are generated after price conditions are met.
They are designed to confirm trend direction rather than predict exact turning points.
Summary
Vulkan Profit is a straightforward MT4 indicator that provides traders with actionable buy and sell signals.
Its arrow-based system helps identify market trends without overwhelming analysis.
This makes it suitable for both new and experienced traders.
The indicator works as a standalone solution or as part of a broader trading approach.
With added alert options or trade filters, its functionality could be expanded further.
For traders seeking a simple yet effective trend-following tool, Vulkan Profit delivers solid performance.


