

About the R Gator Indicator
The R Gator Indicator for MT5 is a trend-following tool derived from the classic Alligator concept, designed to reduce signal delay and improve timing.
It uses three smoothed moving averages that shift forward, allowing traders to anticipate market movements rather than react too late.
The indicator consists of three lines: the blue line (Jaw), red line (Teeth), and green line (Lips).
Each line represents a different market rhythm, and their interaction reveals whether the market is trending or consolidating.
When the lines separate, the market shows strength, while overlapping lines suggest indecision.
This indicator is ideal for traders who want earlier entries in trending conditions.
It performs strongly in both short-term and higher timeframes, making it flexible for scalping, intraday, and swing trading strategies.
Free Download
Key Features
- Three smoothed moving averages with forward shift for early signals.
- Reduced lag compared to the traditional Alligator indicator.
- Helps identify trend direction and market phases.
- Simple visual interpretation with color-coded lines.
- Highlights consolidation and breakout conditions.
Indicator Chart
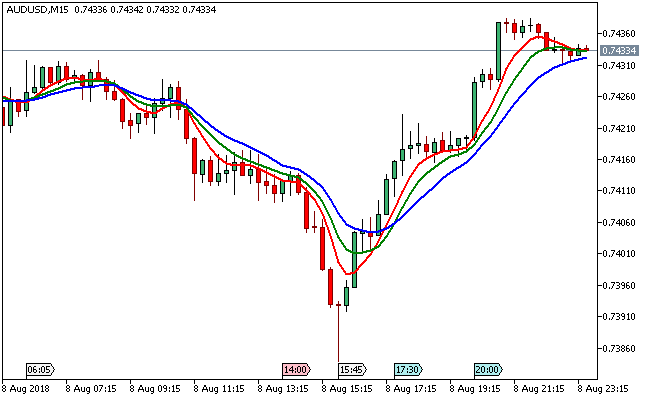
The R Gator Indicator appears directly on the price area with three colored lines moving along the candles.
The chart shows how the lines separate during strong trends and converge when the market slows down, helping traders spot buy and sell opportunities based on line crossovers.
Guide to Trade with R Gator Indicator
Buy Rules
- Wait for the blue line to cross above both the red and green lines.
- Confirm that the lines begin to spread apart after the crossover.
- Ensure price action supports a bullish move.
- Enter a buy trade at the opening of the next candle.
Sell Rules
- Wait for the blue line to cross below both the red and green lines.
- Confirm that the lines begin to separate downward.
- Ensure price action aligns with bearish momentum.
- Enter a sell trade at the opening of the next candle.
Stop Loss
- Place a stop loss below the most recent support area for buy trades.
- Place a stop loss above the most recent resistance area for sell trades.
Take Profit
- Close all buy trades when the indicator lines start to intertwine during an uptrend.
- Close all sell trades when the lines begin to overlap during a downtrend.
- Alternatively, target nearby support or resistance levels.
R Gator Forex Scalping Strategy for MT5
This scalping strategy combines multi-line trend structure with fast momentum confirmation to capture short intraday moves.
The R Gator indicator defines market direction through the alignment of its moving lines, while the RSI Trend Scalper indicator provides timing through quick signal shifts.
The R Gator indicator identifies trend direction by comparing three dynamic lines.
A blue line positioned above both red and green lines confirms bullish structure.
When the blue line shifts below the others, it indicates bearish pressure.
The RSI Trend Scalper complements this by printing a green signal line for buy scalps and a red signal line for sell scalps, helping refine entries in fast-moving conditions.
This strategy is designed for M1 and M5 charts and suits traders who focus on quick executions during active market sessions.
It performs best on liquid currency pairs such as EURUSD, GBPUSD, USDJPY, and AUDUSD where price reacts quickly to momentum shifts.
Buy Entry Rules
- The R Gator blue line is positioned above both red and green lines, confirming bullish trend structure.
- Price holds above the R Gator alignment without breaking structure.
- The RSI Trend Scalper prints a green signal line indicating buy momentum.
- Enter a buy trade at the close of the signal candle.
- Place stop loss below the most recent micro swing low or below the nearest intraday support zone.
- Close the trade when the RSI Trend Scalper prints a red signal line, indicating a momentum shift.
Sell Entry Rules
- The R Gator blue line is positioned below both red and green lines, confirming bearish trend structure.
- Price holds below the R Gator alignment without reclaiming structure.
- The RSI Trend Scalper prints a red signal line indicating sell momentum.
- Enter a sell trade at the close of the signal candle.
- Place stop loss above the most recent micro swing high or above the nearest intraday resistance zone.
- Close the trade when the RSI Trend Scalper prints a green signal line, indicating bullish recovery pressure.
Case Study 1: EURUSD M5 Scalping Trade
During the London session on EURUSD M5, the R Gator blue line stayed above the red and green lines, showing sustained bullish structure.
Price moved in tight waves above this alignment.
The RSI Trend Scalper printed a green signal line, confirming upward momentum.
A buy trade was opened at candle close with a stop loss placed below the recent micro swing low.
Price advanced in a controlled push over several candles.
The RSI Trend Scalper later printed a red signal line, and the long trade was closed as momentum shifted away from bullish continuation.
Case Study 2: USDJPY M1 Scalping Trade
On USDJPY M1 during the Tokyo session, the R Gator structure shifted with the blue line positioned below both red and green lines, confirming bearish control.
Price remained below this alignment with minimal retracement.
The RSI Trend Scalper printed a red signal line, triggering a sell entry at candle close with stop loss above the recent micro high.
Price dropped quickly in short bursts.
The RSI Trend Scalper later printed a green signal line, and the short trade was closed as upward pressure began to build.
Download Now
FAQ
How is the R Gator Indicator different from the standard Alligator?
The R Gator Indicator reduces lag by reacting faster to price changes.
This allows traders to enter trends earlier compared to the traditional Alligator setup.
What do the three lines represent?
The blue line represents long-term movement, the red line shows the medium trend, and the green line tracks short-term price action.
Can this indicator be used for scalping?
Yes, it works well on lower timeframes due to its faster response. Many traders use it to catch short-term momentum shifts.
What does it mean when the lines intertwine?
When the lines overlap, it indicates a ranging market. This is often a signal to exit trades or avoid entering new positions.
Summary
The R Gator Indicator offers a faster and more responsive approach to trend trading by improving on the traditional Alligator concept.
Its ability to highlight early trend formation makes it useful for traders who want better timing on entries and exits.
It adapts well to different timeframes and trading styles, giving flexibility across various market conditions.
While it performs best in trending markets, combining it with other tools can further improve accuracy and trade confidence.
Overall, it provides a practical balance between simplicity and effectiveness, making it a valuable addition to any MT5 trading setup.





