
About the Squize EMA Signal Indicator
The Squize EMA Signal indicator for MT4 is a trend-following tool built around two exponential moving averages that react quickly to price changes.
It uses a fast EMA and a slower EMA wrapped closely around each other to capture short-term momentum shifts.
By default, the indicator applies a 5-period EMA and a 20-period EMA.
When these two lines cross, the indicator signals a potential change in market direction.
Because exponential moving averages prioritize recent price data, the signals tend to appear earlier than those generated by slower trend tools.
The Squize EMA Signal indicator fits traders who want responsive entries and clear directional bias.
The spacing between the EMA lines also provides insight into trend strength, with wider separation reflecting stronger momentum.
Free Download
Download the “squize-ma-indicator.ex4” MT4 indicator
Key Features
- Uses two exponential moving averages for fast signal generation.
- Highlights trend changes through clean EMA crossovers.
- Provides visual insight into momentum strength.
- Can be used as a standalone signal tool or within a strategy.
- Performs strongly across multiple timeframes.
Indicator Chart
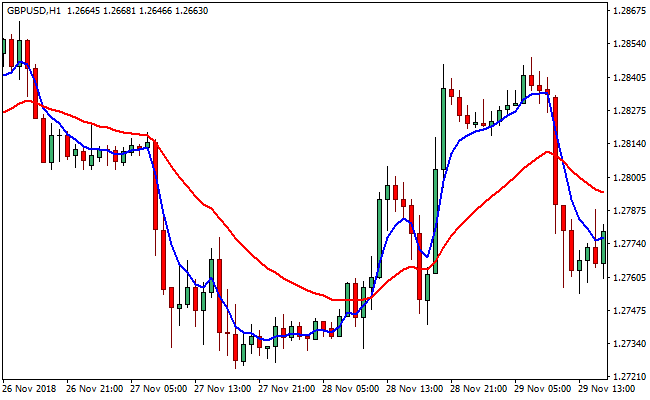
The image below displays the Squize EMA Signal indicator plotted directly on the main price chart.
Blue and red EMA lines show crossover points, trend direction, and changes in momentum.
Guide to Trade with Squize EMA Signal Indicator
Buy Rules
- Wait for the red EMA to cross above the blue EMA.
- Confirm that price begins holding above both EMA lines.
- Enter a buy trade after the crossover is completed.
- Favor setups where EMA separation starts to widen.
Sell Rules
- Wait for the red EMA to cross below the blue EMA.
- Confirm that price begins holding below both EMA lines.
- Enter a sell trade after the crossover is completed.
- Favor setups where EMA separation starts to widen.
Stop Loss
- Place the stop loss just beyond the slower EMA line.
- Use recent price compression near the crossover area.
- Apply a fixed pip stop aligned with timeframe volatility.
- Exit early if price moves back into the EMA overlap.
Take Profit
- Target extended moves as EMA separation increases.
- Scale out profits as momentum begins to slow.
- Trail profits while EMAs remain clearly separated.
- Close the trade when the EMAs cross back.
Squize EMA Signal Indicator + RSI & Bollinger Bands Forex Scalping Strategy
This scalping strategy combines the Squize EMA Signal Metatrader 4 forex indicator with the RSI with Bollinger Bands Trend Reversal Indicator for MT4.
The idea is to catch quick price moves by using the cross of the EMA lines for trend direction and the RSI-Bollinger Bands arrow signals for confirmation.
This setup works best on lower timeframes (M5 or M15) and is suited for traders who prefer fast entries and short-term trades.
Buy Entry Rules
- Wait for the red line of the Squize EMA Signal indicator to cross the blue line from bottom up.
- Confirm that the RSI with the Bollinger Bands indicator shows a green arrow (buy signal) at the same or next candle.
- Enter a long position immediately after the confirmation.
- Set stop loss a few pips below the recent swing low or a recent swing low formed just before the crossover.
- Take profit quickly. Ideal targets are 5–15 pips, or you can exit when the first sign of reversal appears (for example, a red arrow from the RSI-BB indicator or the Squize EMA red line turning downward).
Sell Entry Rules
- Wait for the red line of the Squize EMA Signal indicator to cross the blue line from top to bottom.
- Confirm that the RSI with the Bollinger Bands indicator shows a red arrow (sell signal) at the same or next candle.
- Enter a short position immediately after the confirmation.
- Set the stop loss a few pips above the recent swing high or the high just before the crossover.
- Take profit quickly. Target 5–15 pips, or exit when the first sign of reversal appears (a green arrow from RSI-BB or Squize EMA red line turning upward).
Advantages
- Fast entries and exits are suitable for quick profits during high volatility periods.
- Trading signals from two independent indicators reduce confusion.
- Lower exposure to overnight risk because trades are short-term.
- Works across multiple currency pairs when volatility is high (e.g., EURUSD, GBPUSD).
Drawbacks
- Frequent trades increase spread and commission costs, which can reduce net profit.
- Whipsaw or fake signals may occur during low volatility or congested price action.
- Requires high concentration and quick execution, not ideal for those who cannot monitor charts carefully.
Example Case Study 1
On EURUSD M5, during a London session spike, the Squize EMA red line crossed above the blue line.
Immediately afterwards, the RSI-BB indicator displayed a green arrow.
A long position was opened.
Stop loss was placed 4 pips below the swing low.
Price surged 12 pips within 7 minutes.
Because the setup was strong and volatility was high, the 12-pip target was reached quickly, and the trade was closed for a small but fast profit.
Example Case Study 2
On GBPUSD M15, after a minor retracement, the Squize EMA red line crossed downward through the blue line.
The next candle triggered a red arrow from the RSI-BB indicator.
A short trade was initiated with a stop loss 6 pips above the recent swing high.
The drop was sharp, and 18 pips were captured within 15 minutes before the RSI-BB signaled a potential reversal.
The trade was closed, netting a tidy scalp.
Strategy Tips
- Use this strategy only during active sessions (London, New York) when volatility is reasonable.
- Avoid trading when the market is quiet or near major consolidation zones, as signals tend to be unreliable then.
- Ensure the spread is low because a high spread can reduce small scalp profits quickly.
- Stay disciplined and only trade when both indicators agree (EMA cross and RSI-BB arrow). Do not chase trades.
- Limit the number of trades per day to avoid overtrading. Focus on quality over quantity.
Download Now
Download the “squize-ma-indicator.ex4” Metatrader 4 indicator
FAQ
Why does this indicator react quickly to price changes?
It uses exponential moving averages, which give more weight to recent price action.
What does wider EMA spacing indicate?
A greater distance between the EMA lines reflects stronger trend momentum.
Can the EMA periods be adjusted?
Yes, both EMA values can be modified to match different trading styles.
Is this indicator better for short-term trading?
It works well for short-term and intraday trading, but higher timeframes can also produce stable signals.
Summary
The Squize EMA Signal indicator focuses on fast-moving trend shifts using responsive EMA crossovers.
Its simple layout makes it easy to identify direction changes and momentum strength at a glance.
Clear crossover signals and visual trend confirmation make this indicator a solid option for traders who rely on timing and momentum rather than lagging trend filters.


