
About the Stochastic of RSX Indicator
The Stochastic of RSX Indicator for MT5 combines the Stochastic oscillator with the RSX, a smoother version of RSI.
It highlights overbought and oversold market conditions while minimizing lag.
This indicator works best when trading in the direction of the overall trend.
Combining it with the ADX indicator allows traders to filter trades according to market strength and direction.
Overbought conditions appear when the Stochastic of RSX crosses below the 90 level, while oversold conditions appear when it crosses above the 10 level.
It includes adjustable parameters such as Stochastic period, slowing period, RSX period, price type, and color settings.
Free Download
stochastic-of_rsx.mq5 Indicator (MT5)
Key Features
- Combines Stochastic and RSX for smoother oscillator signals.
- Highlights overbought and oversold market conditions.
- Signals are more accurate when confirmed with ADX trend direction.
- Customizable periods, price types, and colors.
- Clear buy and sell signals based on market extremes.
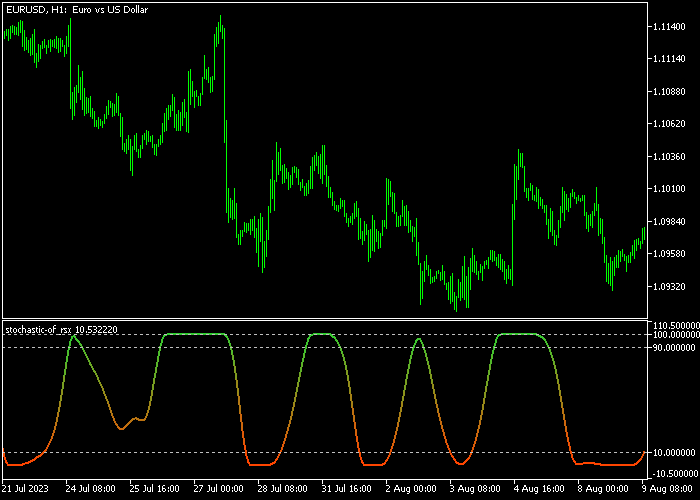
Indicator Chart
This tool plots two white lines that oscillate between 0 and 100 in a separate window.
Crosses above 90 indicate overbought conditions, while crosses below 10 indicate oversold conditions.
Traders combine these signals with ADX trend direction to identify high-probability entries.
Guide to Trade with the Stochastic of RSX Indicator
Buy Rules
- Confirm the currency pair is in an uptrend using ADX.
- Wait for the Stochastic of RSX to cross back above 10 from below.
- Open a buy market order at the next candle open.
- Trade only when ADX indicates a strong trend for higher probability.
Sell Rules
- Confirm the currency pair is in a downtrend using ADX.
- Wait for the Stochastic of RSX to cross back below 90 from above.
- Open a sell market order at the next candle open.
- Trade only when ADX indicates a strong trend for higher probability.
Stop Loss
- Place the stop loss a few pips beyond the nearest swing low for buy trades.
- Place the stop loss a few pips beyond the nearest swing high for sell trades.
- Alternatively, set the stop slightly beyond recent support for buys or resistance for sells.
Take Profits
- Close buy trades when the Stochastic of RSX crosses back below 90.
- Close sell trades when the Stochastic of RSX crosses back above 10.
- Alternatively, exit partially at the next minor support or resistance level.
- Trail the remaining position along recent swing lows for buys or swing highs for sells to capture extended moves.
Stochastic of RSX Starc Bands Scalping Strategy MT5
This scalping strategy combines momentum reversal signals with dynamic trend direction by using the Stochastic of RSX Forex Indicator for MT5 and the Starc Bands Indicator MT5.
It focuses on capturing quick price movements while staying aligned with the short-term trend.
The Stochastic of RSX Forex Indicator is used for precise entry timing.
The Starc Bands Indicator defines the market direction.
When the bands slope upward, the market is in a buy trend. When the bands slope downward, the market is in a sell trend.
This strategy works best on the M1 to M5 timeframes.
By combining a momentum trigger with a trend filter, it avoids trading against the market and improves consistency during volatile sessions.
Buy Entry Rules
- Confirm that the Starc Bands are sloping upward, indicating a bullish trend.
- Wait for the Stochastic of RSX Forex Indicator to cross back above the 10 level from below.
- Enter a buy trade immediately after the crossover is confirmed.
- Place stop loss below the most recent short-term low.
- Close the trade fully when the indicator approaches the 90 level or secure profits near the upper Starc band.
Sell Entry Rules
- Confirm that the Starc Bands are sloping downward, indicating a bearish trend.
- Wait for the Stochastic of RSX Forex Indicator to cross back below the 90 level from above.
- Enter a sell trade immediately after the crossover is confirmed.
- Place a stop loss above the most recent short-term high.
- Close the trade completely when the indicator approaches the 10 level or take profit near the lower Starc band.
Case Study 1: EURJPY Buy Trade
On the M1 timeframe, the Starc Bands begin sloping upward, showing a developing bullish trend.
Shortly after, the Stochastic of RSX crosses back above the 10 level from below.
A buy trade is entered immediately after the signal. Price reacts quickly and moves upward within a short period.
The trade is closed near the upper band, securing a profit of 9 pips.
Case Study 2: USDCHF Sell Trade
On the M5 timeframe, the Starc Bands slope downward, confirming a bearish environment.
Shortly after, the Stochastic of RSX crosses back below the 90 level from above.
A sell trade is placed right after the confirmation.
Price drops steadily as momentum builds in the direction of the trend.
The position is closed near the lower band, capturing a profit of 19 pips.
Download Now
stochastic-of_rsx.mq5 Indicator (MT5)
FAQ
How do I confirm the signals are valid?
Confirm trades by checking the trend direction with ADX or another trend indicator.
Only enter trades that align with the overall trend for higher probability.
How does ADX improve signals?
ADX shows the trend strength.
Combining the stochastic of RSX signals with ADX ensures trades align with strong trends and filters countertrend entries.
Can I customize the indicator settings?
Yes, you can adjust the stochastic period, slowing period, RSX period, price type, colors, and other inputs to suit your strategy.
Summary
The Stochastic of RSX indicator for MT5 identifies overbought and oversold conditions while smoothing signals with RSX.
Combined with ADX, it filters trades in the trend direction for higher probability entries.
Traders can enter on the Stochastic of RSX crosses and manage exits with opposite signals or trailing stops.
This approach adapts to market trends and helps capture trend momentum efficiently.


