
About the Ticks Indicator
The Ticks indicator for MT5 creates a dedicated tick chart that updates with each market movement.
It plots bid and ask prices in real time, helping traders track price fluctuations more precisely.
The bid price is displayed as a blue line, while the ask price is shown as a red line.
It allows traders to monitor spreads, liquidity, and order flow in a clear format.
The indicator lets you adjust the number of ticks displayed and the point increments.
This flexibility allows fine-tuning for different trading styles and market conditions.
Free Download
Key Features
- Dedicated tick chart for real-time price tracking.
- Blue line for bid price and red line for ask price.
- Adjustable number of ticks and point increments.
- Visualizes spread changes instantly.
- Ideal for scalping and short-term trading strategies.
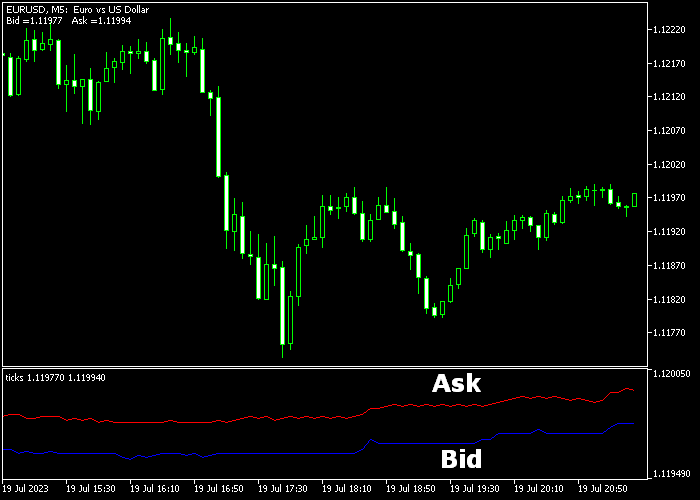
Indicator Chart
The Ticks indicator displays a live tick chart in a separate window below the main price area.
The blue bid line and red ask line update dynamically with each market tick.
This provides an accurate view of micro price movements, helping traders make precise entry and exit decisions.
The chart is particularly useful for observing spread behavior during active trading sessions.
Guide to Trade with the Ticks Indicator
Buy Rules
- Identify narrowing spread or bullish price movement on the tick chart.
- Confirm alignment with the higher timeframe trend for direction.
- Open a buy trade when the bid price shows a strong upward movement.
- Monitor the ask line behavior for confirmation of momentum.
Sell Rules
- Identify narrowing spread or bearish price movement on the tick chart.
- Confirm alignment with the higher timeframe trend for direction.
- Open a sell trade when the ask price shows strong downward movement.
- Monitor bid line behavior for confirmation of momentum.
Stop Loss
- Set stop loss based on nearby micro-support or resistance levels.
- Ensure stops respect the current bid/ask spread.
Take Profits
- Close buy trades when price momentum slows or reverses on the tick chart.
- Close sell trades when price momentum slows or reverses on the tick chart.
- Alternatively, target fixed pip gains for scalping.
Download Now
FAQ
How does this indicator help with scalping?
It shows real-time bid and ask movements, allowing scalpers to track spreads and short-term momentum for precise entries and exits.
Can the number of ticks be adjusted?
Yes. Traders can increase or decrease the number of ticks displayed to control chart detail and manage visual noise.
Can it be used alongside other indicators?
Yes. It pairs well with trend, support/resistance, or momentum indicators to refine entry and exit timing.
Summary
The Ticks indicator provides a precise view of bid and ask price movements in real time.
Its dedicated tick chart helps traders monitor micro price action and spreads accurately.
With adjustable tick and point settings, it supports scalpers and intraday traders looking for better timing and improved trade execution.
Combining it with other technical tools enhances decision-making in fast-moving markets.


