About the Ticks Volume Indicator
The Ticks Volume indicator for MT5 is a technical tool that quantifies the intensity of market activity.
Unlike standard volume tools that look at the total monetary value of trades, this indicator focuses on the frequency of price changes, known as ticks.
Each tick represents a transaction or a change in price, offering a high-resolution view of how active a currency pair is at any given moment.
High tick volume during a price move suggests strong conviction, while low volume often precedes a reversal or a period of consolidation.
By observing the flow of these ticks, traders can distinguish between significant institutional moves and minor retail noise.
It serves as a secondary confirmation for any price action strategy, ensuring you enter the market when participation is at its highest.
Free Download
TicksVolume.mq5 Indicator (MT5)
Key Features
- Measures the total number of price updates in real-time for any selected period.
- Provides a clear representation of market liquidity and trader participation levels.
- Includes customizable settings for pips and tick movements to refine data accuracy.
- Helps identify potential market exhaustion points during extended trends.
- Functions as a reliable filter to avoid low-liquidity market environments.
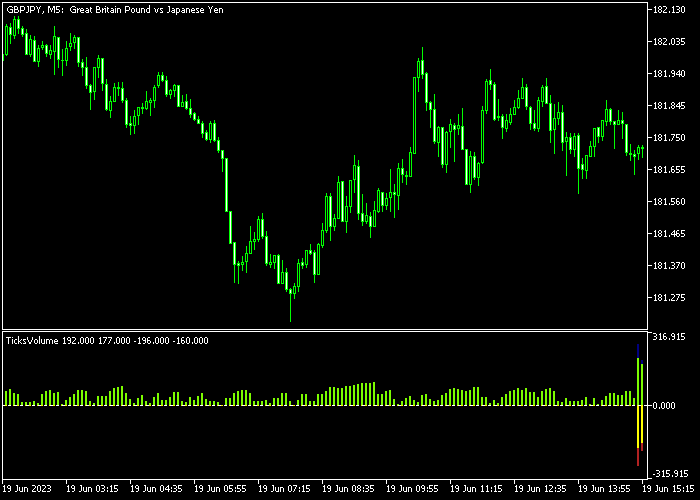
Indicator Chart
The chart displays the Ticks Volume indicator in the bottom sub-window, showing the fluctuations in market activity.
You can observe how the bars rise during periods of high volatility, signaling that a large number of participants are entering the market.
This data helps you align your trades with the periods of greatest market momentum.

Guide to Trade with the Ticks Volume Indicator
Buy Rules
- Wait for price to approach a key demand zone or a bullish trendline.
- Observe a significant increase in the tick volume bars as price bounces.
- Open a buy trade once the high-volume bullish candle has fully closed.
- Ensure the volume remains consistently high to support the upward move.
Sell Rules
- Identify a situation where price is testing a major supply zone or resistance.
- Look for a surge in tick volume that coincides with a bearish candlestick pattern.
- Execute a sell order immediately after the high-volume bearish confirmation.
- Avoid selling if the volume is declining, as this indicates a lack of interest.
Stop Loss
- For buy trades, place the stop loss below the low of the high-volume candle.
- For sell trades, set the stop loss above the high of the signaling candle.
- Adjust the stop loss to account for the typical volatility seen during volume spikes.
Take Profit
- Target a profit level that offers at least a 1:1.5 reward relative to your risk.
- Consider exiting the trade if the tick volume starts to dry up significantly.
- Use the next major technical level as a primary target for closing the position.
- Scale out of the trade if a volume spike occurs in the opposite direction.
Download Now
TicksVolume.mq5 Indicator (MT5)
FAQ
What is the difference between tick volume and real volume?
Tick volume measures the number of times price changes, whereas real volume measures the total number of contracts or lots traded.
In Forex, tick volume is a highly accurate proxy for real volume because price changes more frequently when more money enters the market.
Can this indicator predict a market reversal?
It can identify potential reversals through volume divergence.
If price makes a new high but the Ticks Volume indicator shows a lower peak, it suggests that the trend is losing steam and a reversal may be imminent, providing an early warning to traders.
Summary
The Ticks Volume indicator provides a streamlined approach to technical analysis by merging trend detection with momentum filtering.
It allows traders to navigate different market conditions by visually separating bullish impulses from bearish pressure.
Because the signals do not repaint, the tool remains a reliable choice for those executing fast-paced strategies like scalping or day trading.


