
About the Two MA Square Bars Indicator
The Two MA Square Bars indicator for MT5 is a beginner friendly trading tool that helps traders identify trend direction using a simple visual signal system.
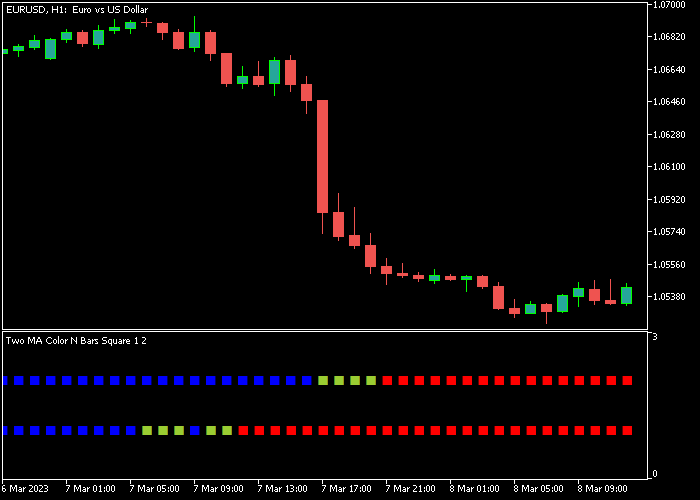
It displays colored squares based on two moving averages, allowing traders to quickly understand whether the market is leaning bullish or bearish.
The indicator appears beneath the price area in a separate window and forms two rows of colored squares.
When both rows turn blue, the market is showing bullish momentum.
When both rows turn red, bearish momentum is taking control.
Because the indicator is based on moving averages, it reacts to trend changes and filters out some market noise.
Traders can adjust several settings including the averaging period for both moving averages, horizontal shift, smoothing type, and the price type used in calculations.
Free Download
Two MA Color N Bars Square.mq5 Indicator (MT5)
Key Features
- Displays two rows of colored squares derived from moving averages.
- Blue squares indicate bullish momentum.
- Red squares indicate bearish momentum.
- Simple visual signals that help traders follow market direction.
- Customizable moving average periods.
- Adjustable smoothing type and price calculation method.
Indicator Chart
The Two MA Square Bars Indicator appears beneath the main price area and displays two horizontal rows of colored squares.
Blue squares highlight bullish momentum while red squares show bearish pressure, helping traders recognize potential trend shifts.
Guide to Trade with Two MA Square Bars Indicator
Buy Rules
- Wait for the first two blue squares to appear in the indicator rows.
- Confirm that both rows of squares remain blue to indicate bullish momentum.
- Open a buy trade once the bullish signal forms.
- Avoid entering directly below strong resistance levels.
Sell Rules
- Wait for the first two red squares to appear in the indicator rows.
- Confirm that both rows remain red to signal bearish pressure.
- Open a sell trade once the bearish signal forms.
- Avoid entering directly above strong support levels.
Stop Loss
- Place the stop loss below short-term support for buy trades.
- Place the stop loss above short-term resistance for sell trades.
- Adjust stop loss distance based on timeframe volatility.
Take Profit
- Close the buy trade when two red squares appear.
- Close the sell trade when two blue squares appear.
- Some traders trail the stop loss during strong trends.
Download Now
Two MA Color N Bars Square.mq5 Indicator (MT5)
FAQ
What do the colored squares represent?
The colored squares represent the direction of two moving averages used by the indicator.
Blue squares signal bullish conditions, while red squares indicate bearish market pressure.
Can the moving average settings be customized?
Yes. Traders can adjust the averaging periods for both moving averages, the smoothing method, horizontal shift, and the price type used in the calculation.
Which timeframes work best with this indicator?
The indicator can be used on any timeframe.
Many traders prefer M15, M30, and H1 because they balance signal frequency and trend stability.
Is the Two MA Square Bars Indicator suitable for beginners?
Yes. The visual design and simple signal logic make it easy for new traders to understand market direction and potential entry opportunities.
Summary
The Two MA Square Bars Indicator provides a straightforward way to track market momentum using moving average signals.
The colored square rows offer a simple visual method to identify bullish and bearish conditions.
Because the indicator relies on moving averages, it follows the general market trend and helps traders stay aligned with directional momentum.
With adjustable settings and clear visual signals, the Two MA Square Bars Indicator can support both beginner and experienced traders who want an easy way to monitor trend direction.


