
About the Value Trend Reversal Indicator
The Value Trend Reversal indicator for Metatrader 5 is a specialized tool designed to detect potential turning points in exhausted market trends.
It focuses on low-risk opportunities by signaling early trend reversals before significant price movements occur.
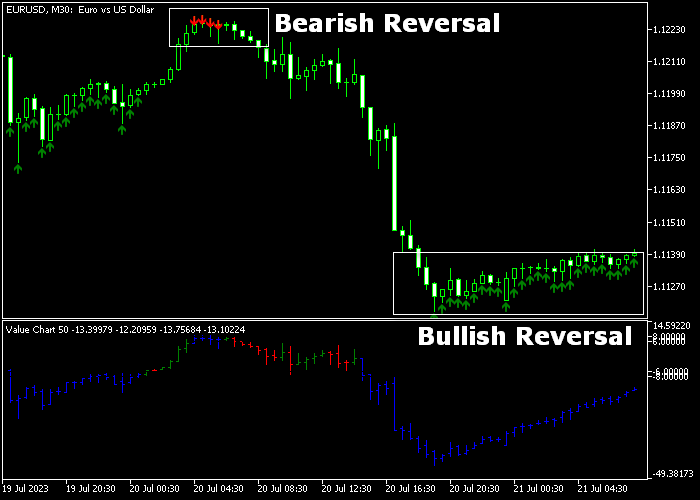
The indicator draws colored arrows directly on the price chart: green arrows signal a potential bullish reversal, while red arrows indicate a possible bearish reversal.
These signals allow traders to anticipate trend changes and enter trades with a higher probability of success.
Beyond simple signals, the indicator analyzes recent market momentum and identifies areas where the prevailing trend may be losing strength.
This makes it particularly effective for scalpers and day traders seeking to capitalize on rapid market fluctuations during high-volatility periods.
Users can fully customize the indicator’s settings, including the signal period, arrow display, and arrow colors, allowing it to adapt to different trading styles and risk preferences.
Free Download
value_charts.mq5 Indicator (MT5)
Key Features
- Early trend reversal signals with colored arrows.
- Customizable input parameters for period and arrow appearance.
- Suitable for scalping and day trading strategies.
- Works on any timeframe to match your preferred trading style.
Indicator Chart
The chart highlights buy and sell signals using green and red arrows.
It clearly shows potential reversal points, allowing traders to anticipate trend shifts and plan entries accordingly.
Guide to Trade with Value Trend Reversal Indicator
Buy Rules
- A green arrow appears on the chart, indicating a potential bullish reversal.
- Open a buy market order following the arrow signal.
- Monitor for subsequent red arrows as a potential exit signal.
Sell Rules
- A red arrow appears on the chart, signaling a potential bearish reversal.
- Open a sell market order following the arrow signal.
- Watch for a green arrow as an exit signal or optional profit target.
Stop Loss
- For buy trades, place the stop loss a few pips below the nearest support area identified on the chart.
- For sell trades, place the stop loss a few pips above the nearest resistance area identified on the chart.
Take Profits
- Consider closing trades when the opposite arrow appears on the chart.
- Set a fixed take profit based on your preferred risk-to-reward ratio.
- Combine arrow signals with support and resistance zones for better targets.
- Partial profits can be taken while letting the remaining position run with the trend.
Value Trend Reversal Precision Strategy MT5 with Signal Levels Confirmation
This strategy combines the Value Trend Reversal indicator for MT5 with the Simple Signal Levels indicator for MT5.
It is designed to capture early trend reversals and confirm them with clear price level validation.
The approach focuses on spotting reversal signals at the right moment and avoiding false entries by waiting for price confirmation.
The Value Trend Reversal indicator provides early directional signals, while the Simple Signal Levels indicator ensures that price supports the move.
This method works best on M5 and M15 timeframes.
Buy Entry Rules
- Wait for a green arrow from the Value Trend Reversal indicator, signaling a bullish reversal.
- Confirm that a candle closes above the blue Vibrix line from the Simple Signal Levels indicator.
- Enter a buy trade at the close of the confirmation candle.
- Place the stop loss below the most recent swing low.
- Take profit when price reaches the next resistance level or when an opposite trading signal appears.
Sell Entry Rules
- Wait for a red arrow from the Value Trend Reversal indicator, signaling a bearish reversal.
- Confirm that a candle closes below the red line from the Simple Signal Levels indicator.
- Enter a sell trade at the close of the confirmation candle.
- Place the stop loss above the most recent swing high.
- Take profit when price reaches the next support level or when an opposite signal appears.
Case Study 1: EUR/USD M5 Buy Reversal Trade
On the EUR/USD M5 timeframe, price was in a short-term downtrend before a green arrow appeared from the Value Trend Reversal indicator.
This signaled a potential shift in direction.
Shortly after, a candle closed above the blue Vibrix line, confirming bullish momentum.
A buy trade was opened at candle close with the stop loss placed below the recent swing low.
Price moved upward steadily as the new trend developed.
The trade was closed near a resistance level, securing a 23 pip profit.
Case Study 2: GBP/JPY M15 Sell Reversal Trade
On the GBP/JPY M15 timeframe, price had been rising before a red arrow appeared from the Value Trend Reversal indicator, indicating a bearish reversal.
A candle then closed below the red signal line, confirming selling pressure.
A sell trade was executed at candle close with the stop loss placed above the recent swing high.
Price declined with momentum as the trend reversed.
The trade was closed near a support level, capturing a 47 pip gain.
Download Now
value_charts.mq5 Indicator (MT5)
FAQ
How are the arrows generated?
The indicator detects exhausted trends and signals early reversals.
Green arrows indicate potential bullish shifts, while red arrows indicate potential bearish shifts.
Can I customize the appearance of signals?
Yes. You can adjust the period, show or hide arrows, and modify the arrow colors for better visibility according to your preferences.
Summary
The Value Trend Reversal indicator provides early signals of potential trend reversals, helping traders enter trades with lower risk.
Green and red arrows simplify decision-making by highlighting bullish and bearish reversals directly on the chart.
Customizable settings allow adaptation to any trading style, while the indicator remains effective across all timeframes and instruments.
Traders can use it to anticipate market shifts, optimize entry points, and manage trades efficiently with clear visual cues from the arrows.


