
The Vidya Zone Forex indicator for Metatrader 5 delivers simple, yet accurate buying and selling trade opportunities to currency traders.
It should perform well when utilized as a standalone buying and selling technical tool.
How do you trade Forex with it?
- A buy signal is generated when the green Vidya Zone line initiates.
- A sell signal is generated when the orange Vidya Zone line initiates.
The indicator allows customizing the following settings and parameters: vidya period, smoothing period, and line style.
Please make yourself familiar with the Vidya Zone indicator and test it first on a demo account before applying it to a live account.
Keep in mind that its trading performance may fluctuate based on market conditions, so it’s crucial to maintain realistic expectations.
Download Indicator 🆓
Vidya_zone.mq5 Indicator (MT5)
Chart Example
The picture below illustrates how the Vidya Zone Forex indicator looks like when applied to the MT5 chart.
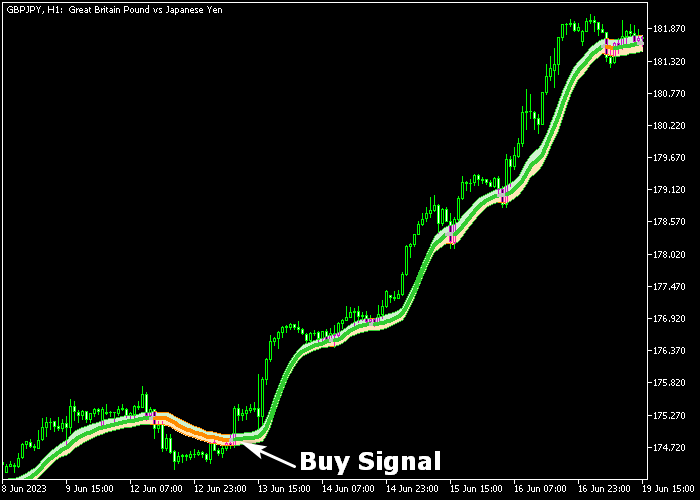
How To Buy And Sell Currency Pairs With The Vidya Zone Forex Indicator?
Find a simple trading example below:
Buy Signal
- The green colored Vidya line signals a buy trade.
- Initiate a buy transaction and place a stop below the most recent swing low.
- Exit the buy trade for a risk to reward ratio of at least 1.5, or wait for a sell signal.
Sell Signal
- The orange colored Vidya line signals a sell trade.
- Initiate a sell transaction and place a stop above the most recent swing high.
- Exit the sell trade for a risk to reward ratio of at least 1.5, or wait for a buy signal.
Download Now 🆓
Vidya_zone.mq5 Indicator (MT5)
Frequently Asked Questions
How Do I Install This Custom Indicator On Metatrader 5?
- Open the MT5 trading platform
- Click on the File menu button located at the top left part of the platform
- Click on Open Data Folder > MQL5 folder > Indicators
- Copy the Vidya_zone.mq5 indicator file in the Indicators folder
- Close and restart the trading platform
- You will find the indicator here (Navigator window > Indicators)
- Drag the indicator to the chart to get started with it!
How Do I Edit This Indicator?
- Click in the open chart with your right mouse button
- In the dropdown menu, click on Indicator List
- Select the indicator and click on properties
- Now you can edit the inputs, colors, levels, scale and visualization
- Finally click the OK button to save the new configuration


