The Vinni Trend WPR indicator for MT4 combines trend direction with Williams Percent Range analysis to help traders identify momentum shifts and potential entry points.
It highlights bullish and bearish market conditions directly on the trading platform, making it easier to follow active trends and spot possible reversals.
This indicator works well for Forex traders who prefer clear visual signals for scalping, intraday trading, and trend-following strategies.
Free Download
Download the “VininI_Trend_WPR.mq4” indicator for MT4
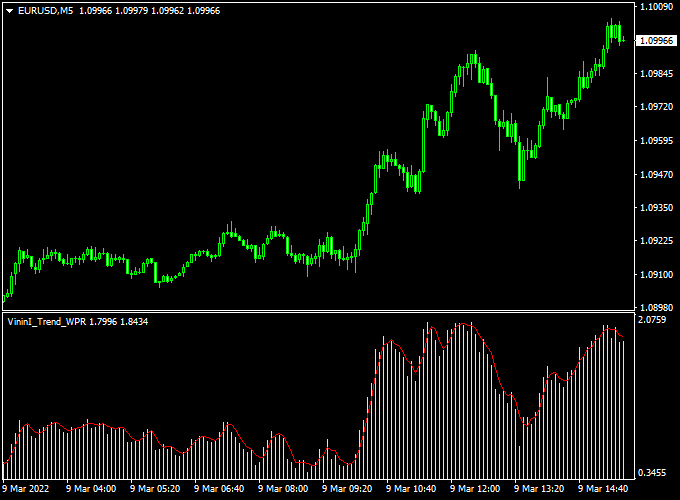
Indicator Chart (EUR/USD M5)
The example chart below showcases the Vinni Trend WPR indicator in action on the EURUSD M5.

Guide to Trade with Vinni Trend WPR Indicator
Vinni Trend WPR Indicator Buy Rules
- Open a buy trade when the histogram starts rising and shows bullish momentum increasing.
- Confirm that the WPR line moves upward from the oversold zone.
- Enter the trade after a bullish candle closes above the previous candle.
- Place the stop loss below the recent swing low or below the nearest support level.
- Close the buy trade when the histogram starts falling or when the WPR turns downward from the overbought zone.
Vinni Trend WPR Indicator Sell Rules
- Open a sell trade when the histogram starts falling and shows bearish momentum increasing.
- Confirm that the WPR line moves downward from the overbought zone.
- Enter the trade after a bearish candle closes below the previous candle.
- Place the stop loss above the recent swing high or above the nearest resistance level.
- Close the sell trade when the histogram starts rising or when the WPR turns upward from the oversold zone.
Vinni Trend WPR + XMaster Formula MT4 Forex Strategy
This strategy combines the Vinni Trend WPR Forex Indicator for MT4 with the XMaster Formula MT4 Forex Indicator.
It is designed for fast-paced trading on M5 and H1 charts, helping traders capture short-term trends with clear entry and exit points.
The Vinni Trend WPR identifies rising and falling market trends through yellow histogram bars, while the XMaster Formula provides precise buy and sell signals via yellow arrows.
How This Strategy Works
The Vinni Trend WPR shows market direction using histogram bars: upward trends are identified by rising bars, downward trends by falling bars.
The XMaster Formula confirms the trade with arrows: a yellow UP arrow signals a buy, and a yellow DOWN arrow signals a sell.
Forex trades are executed only when both indicators align, improving accuracy and reducing false signals.
Buy Entry Rules
- Confirm that the Vinni Trend WPR histogram is rising, indicating an uptrend.
- Wait for a yellow UP arrow from the XMaster Formula indicator.
- Enter a buy trade at the close of the candle where both conditions appear.
- Set a stop-loss below the recent swing low.
- Take profit: 10–20 pips on M5 or 30–50 pips on H1, or exit when the histogram starts falling or a yellow DOWN arrow appears.
Sell Entry Rules
- Confirm that the Vinni Trend WPR histogram is falling, indicating a downtrend.
- Wait for a yellow DOWN arrow from the XMaster Formula indicator.
- Enter a sell trade at the close of the candle where both conditions appear.
- Set a stop-loss above the recent swing high.
- Take profit: 10–20 pips on M5 or 30–50 pips on H1, or exit when the histogram starts rising or a yellow UP arrow appears.
Advantages
- Combines trend detection with precise entry signals for higher probability trades.
- Works on both short-term (M5) and longer intraday (H1) charts.
- Reduces trading against the trend and increases trade confidence.
Drawbacks
- Profit targets are relatively small on M5, requiring multiple trades for meaningful gains.
- Trades may be prematurely exited if the histogram fluctuates near neutral levels.
Case Study 1 – EUR/USD M5 Chart
During the London session, the Vinni Trend WPR histogram rose, and a yellow UP arrow appeared on the XMaster Formula indicator.
A buy trade was entered at 1.1015 with a stop-loss at 1.1005.
The price reached the take-profit target of 15 pips within 12 minutes before the histogram began to flatten.
Case Study 2 – GBP/JPY H1 Chart
On GBP/JPY, the Vinni Trend WPR histogram was falling while a yellow DOWN arrow appeared on the XMaster Formula.
A sell trade was entered at 187.60 with a stop-loss at 187.80.
The trade moved in favor and hit a 45-pip take-profit target over the next two hours.
Strategy Tips
- Trade major currency pairs with tight spreads for better execution.
- Focus on high-liquidity periods for more reliable trend signals.
- Adjust stop-loss levels based on pair volatility.
- Ensure both the histogram trend and the arrow signal align before entering a trade.
- Consider exiting early if the histogram changes slope or a counter arrow appears.
By combining trend identification from Vinni Trend WPR with the precise entry signals from XMaster Formula, traders can take disciplined trades on M5 and H1 charts.
Applying proper risk management and disciplined execution allows consistent capture of short-term intraday moves.
Download Now
Download the “VininI_Trend_WPR.mq4” indicator for Metatrader 4


