About the Waddah Attar Fibo Indicator
The Waddah Attar Fibo indicator for MT5 is a technical tool that automates the calculation and plotting of daily Fibonacci levels.
Unlike standard drawing tools, it recalculates twelve distinct levels every trading day to reflect the most recent price action and volatility.
By dividing the chart into six upper and six lower Fibonacci zones, it allows traders to plan their exits with high precision.
It is particularly valuable for day traders and scalpers who need to identify intraday targets quickly without manual calculations.
Because it updates daily, it ensures that your profit targets remain relevant to the current market environment and structural shifts.
Free Download
waddahattarfibo.mq5 Indicator (MT5)
Key Features
- The indicator plots 12 automated Fibonacci levels that refresh every 24 hours.
- Six upper levels are designated as targets for bullish momentum and buy trades.
- Six lower levels act as primary take-profit zones for bearish moves and sell trades.
- Customizable chart period settings allow the levels to adapt to different trading frequencies.
- Horizontal and vertical shift parameters offer flexibility in how levels appear on the screen.
- The tool integrates seamlessly with other oscillators or trend-following indicators.
Indicator Chart
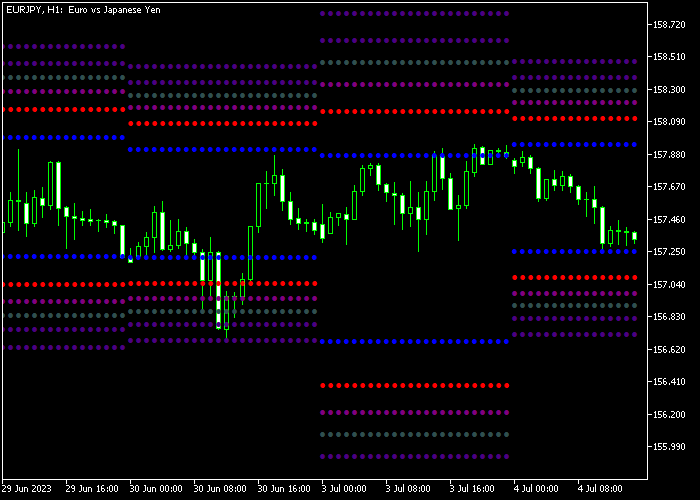
The chart below shows the Waddah Attar Fibo indicator displaying a grid of horizontal lines across the price action.
You can see how the daily price expansion often reaches toward these specific levels before consolidating.
These lines provide a clear visual guide for setting exit points during the trading session.

Guide to Trade with Waddah Attar Fibo indicator
Buy Rules
- Confirm a bullish market bias using your primary trend indicator or price action analysis.
- Enter a buy market order once a valid entry signal is generated by your core system.
- Identify the six upper Fibonacci lines as potential destinations for the upward move.
- Close the trade when price reaches your selected Fibonacci target level for the day.
Sell Rules
- Ensure the current market trend is bearish according to your technical trading setup.
- Execute a sell market order following a confirmed downward momentum trigger.
- Monitor the six lower Fibonacci lines to determine the most likely area for price to land.
- Maintain the short position until the price hits one of the lower daily target levels.
Stop Loss
- Place your protective stop loss 3 pips below the most recent swing low for all buy trades.
- Set a defensive stop loss 3 pips above the most recent swing high for sell market orders.
- The central pivot level of the Fibonacci grid can also serve as a logical stop point.
- Adjust the stop to break-even once the first target level is successfully achieved.
Take Profit
- Target any of the higher 6 Waddah Attar Fibo levels to secure gains on long positions.
- Set your profit objective at any of the lower 6 levels for all short transactions.
- Partial profits can be taken at the closer levels while trailing the rest to further targets.
- Manual exits are recommended if price action shows signs of exhaustion before hitting a line.
Waddah Attar Fibo Day Trading Strategy for MT5
This day trading strategy combines momentum-based entries with precise Fibonacci-based exits using the RSI Swings Indicator and the Waddah Attar Fibo Indicator.
It is designed to help traders enter on clear directional signals and exit trades at structured intraday target levels.
The RSI Swings indicator highlights momentum shifts through a color-coded histogram.
Green bars reflect bullish pressure, while red bars indicate bearish movement.
This makes it easy to spot short-term opportunities during the trading day.
The Waddah Attar Fibo automatically plots daily Fibonacci levels, dividing the market into multiple upper and lower zones.
These levels act as dynamic take profit targets, allowing traders to manage exits with accuracy based on current volatility and price structure.
This strategy performs best on M5 and M15 timeframes and is effective during active sessions such as London and New York.
Buy Entry Rules
- Wait for the RSI Swings histogram to turn green.
- Confirm that price is showing upward momentum with bullish candles.
- Enter a buy trade at the close of the signal candle.
- Place the stop loss below the recent swing low.
- Close the trade when the histogram turns red.
- You can also scale out profits progressively at the upper Fibonacci levels plotted by the Waddah Attar Fibo indicator.
Sell Entry Rules
- Wait for the RSI Swings histogram to turn red.
- Confirm bearish momentum with strong downward candles.
- Enter a sell trade at the close of the signal candle.
- Place the stop loss above the recent swing high.
- Close the trade when the histogram turns green.
- Alternatively, use the lower Fibonacci levels as step-by-step profit targets.
Case Study 1: EURUSD M5 Buy Setup
On EURUSD M5 during the London session, the RSI Swings histogram turned green after a short consolidation phase, signaling a bullish shift.
A buy trade was entered at candle close as momentum picked up.
The stop loss was 3 pips placed below the recent swing low.
Price moved upward steadily and reached multiple upper Fibonacci zones.
The trade was managed by taking partial profits at these levels and was fully closed when the histogram turned red.
Case Study 2: GBPCHF M15 Sell Setup
On GBPCHF M15 during the New York session, the RSI Swings histogram turned red, indicating growing bearish pressure.
A sell trade was entered after the signal candle closed. The stop loss was placed 3 pips above the recent swing high.
Price moved downward and interacted with several lower Fibonacci levels.
The short trade was gradually reduced at these levels and fully closed when the histogram turned green.
Download Now
waddahattarfibo.mq5 Indicator (MT5)
FAQ
How often do the Fibonacci levels change?
The indicator recalculates all 12 levels every day. This ensures the targets are always based on the most recent volatility and price range of the previous trading sessions.
Can I use this as a standalone signal indicator?
No, this tool is designed for target setting. It should be combined with a trend or momentum indicator that provides the initial buy or sell entry signal.
Which timeframe is best for this indicator?
While it works on all timeframes, it is most effective on M15, M30, and H1 charts. These periods allow the daily levels to act as reliable intraday profit objectives.
Summary
The Waddah Attar Fibo indicator automates the complex task of drawing Fibonacci targets, providing a consistent framework for daily profit taking.
By updating every 24 hours, it stays in sync with current market conditions and price ranges.
Its simple visual layout helps traders maintain discipline and avoid exiting trades prematurely.
Overall, it is an essential utility for anyone looking to add mathematical precision to their trade management and target identification.


