Skip to content

ZigZag MACD Candle Indicator For MT5

    The ZigZag MACD Candle indicator for Metatrader 5 follows the trend and delivers easy-to-follow buy and sell trading signals.

    By merging the ZigZag and MACD, this indicator enhances the prediction of currency trends and minimizes delays.

    This tool is particularly advantageous for scalpers and day traders who engage in trend-based trading.

    How can you identify trend direction using the ZigZag MACD Candle indicator?

    • Sea-green colored candles indicate a buy trend.
    • Magenta-colored candles suggest a sell trend.

    The indicator includes several inputs and parameters, such as MACD settings, zigzag settings, colors, and more.

    Download Indicator

    zig-zag-macd-candle.mq5 Indicator (MT5)

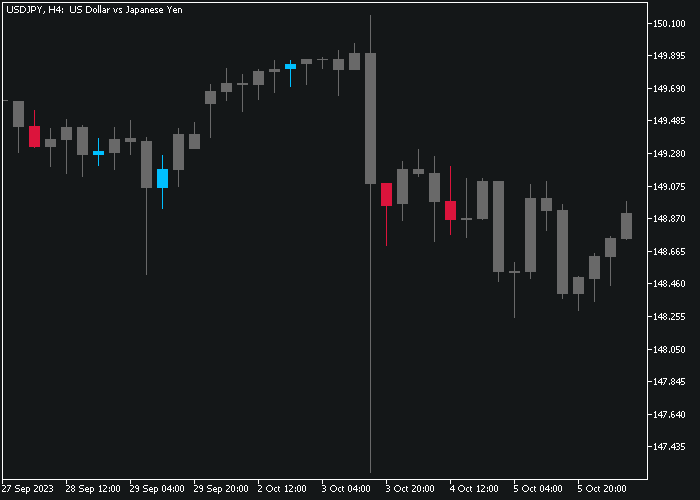
    Trade Chart Example GBPUSD H1

    The picture below illustrates what the ZigZag MACD Candle indicator looks like when applied to the MT5 chart.

    How To Buy And Sell Using The ZigZag MACD Candle Indicator?

    Find a simple trading strategy below:

    Buy Signal

    • A buy signal is generated when the first sea-green colored candle gets displayed on the chart.
    • Open a buy trade and place a stop loss below short-term support.
    • Close the buy trade for a 10-25 pip potential profit.
    • Alternatively, await a sell signal to close the buy trade.

    Sell Signal

    • A sell signal is generated when the first magenta-colored candle appears on the chart.
    • Open a sell trade and set a stop loss above short-term resistance.
    • Close the sell trade for a 10-25 pip potential profit.
    • Alternatively, await a buy signal to close the sell trade.

    Download Now

    zig-zag-macd-candle.mq5 Indicator (MT5)

    High-Probability Reversal MT5 Strategy Using ZigZag MACD Candle + Boom Crash Indicator

    This strategy combines the power of the ZigZag MACD Candle Indicator with the precision of the Boom Crash Indicator. It is designed for traders looking to catch major spikes, reversals, or continuation entries on Boom and Crash indices or similar volatile markets.

    Strategy Overview

    • ZigZag MACD Candle: Highlights market swing points and trend direction using color-coded candles and MACD momentum.
    • Boom Crash Indicator: Provides entry alerts, spike zones, and directional bias tailored to Boom/Crash indices.

    Timeframes and Market

    • Best Timeframes: M1, M5, M15
    • Markets: Boom 1000, Crash 1000, Boom 500, Crash 500

    Buy Trade Conditions (Crash Index)

    • Wait for a significant low marked by the ZigZag MACD Candle with green bullish candle confirmation.
    • Confirm buy signal from the Boom Crash Indicator (spike zone, alert, or trend arrow).
    • Enter at the close of the bullish candle with confirmation.
    • Stop loss below the recent swing low or support zone.
    • Take profit at the next resistance level or fixed pip target (e.g., 20–30 pips).

    Sell Trade Conditions (Boom Index)

    • Look for a ZigZag MACD candle forming a swing high and turning red (bearish).
    • Wait for the Boom Crash Indicator to confirm with a sell signal (arrow, zone, or bearish alert).
    • Enter on the confirmation candle close.
    • Place stop loss above the recent swing high.
    • Exit with a 1.5x–2x reward-risk ratio or at key support.

    Tips for Maximum Success

    • Use this strategy during periods of volatility or active market sessions.
    • Avoid trades during sideways consolidation or when ZigZag shows a flat structure.
    • Combine this setup with price action zones or support/resistance for better results.

    🔗 Get the Boom Crash Indicator

    Frequently Asked Questions

    How Do I Install This Custom Indicator On Metatrader 5?

    • Open the MT5 trading platform
    • Click on the File menu button located at the top left part of the platform
    • Click on Open Data Folder > MQL5 folder > Indicators
    • Copy the zig-zag-macd-candle.mq5 indicator file in the Indicators folder
    • Close and restart the trading platform
    • You will find the indicator here (Navigator window > Indicators)
    • Drag the indicator to the chart to get started with it!
    Share this post!