
About the 3 EMAs Indicator
The 3 EMAs Indicator for MT4 is a comprehensive trend analysis system that tracks market momentum across short, medium, and long-term horizons.
Most traders struggle to maintain perspective when price action becomes volatile, but this tool solves that problem by using three distinct exponential moving averages.
By plotting these levels in a dedicated window, it allows you to observe how different market cycles interact without cluttering your main activity chart.
The indicator typically utilizes the 10, 50, and 200 periods to represent immediate momentum, intermediate trends, and institutional bias.
This system works by identifying periods of synchronization where all three market phases align.
When the short-term average leads the medium-term, and both remain above the long-term baseline, it signals a healthy and sustainable trend.
This methodology helps you avoid entering the market during low-probability corrections or choppy consolidation phases.
Free Download
Download the “price-emas.mq4” MT4 indicator
Key Features
- Incorporates three separate exponential moving average calculations for layered market analysis.
- Uses a separate window format to keep the primary price chart clean and easy to read.
- Identifies trend alignment by tracking the 10, 50, and 200 periods simultaneously.
- Provides objective signals based on the mathematical stacking of price averages.
- Supports full customization of all period inputs to suit different trading personalities.
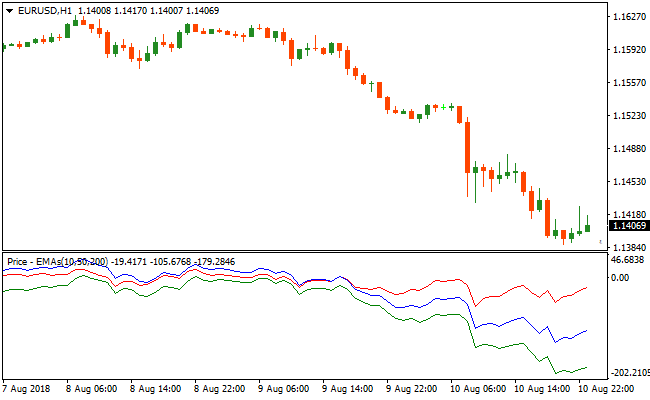
Indicator Chart
The chart displays the 3 EMAs Indicator functioning as a momentum filter in a sub-window below the price candles.
You can see how the lines expand and stack during strong trends, providing a roadmap for entry and exit points.
When the lines are fanned out in order, it confirms that the market is in a high-probability trending state.
Guide to Trade with 3 EMAs Indicator
Buy Rules
- Check the indicator window to ensure the 10 EMA is positioned above the 50 EMA indicator.
- Verify that both the 10 and 50 periods are trading above the 200 EMA indicator.
- Wait for a bullish price action signal on the main chart to confirm the entry.
- Initiate the long position once all three averages are stacked in bullish order.
Sell Rules
- Monitor the sub-window until the 10 EMA crosses below the 50 EMA indicator.
- Ensure that both the 10 and 50 averages are trending below the 200 EMA indicator.
- Look for a bearish candle close to confirm that sellers are increasing their pressure.
- Execute the short trade when the three averages are stacked in a bearish alignment.
Stop Loss
- For buy trades, place the stop loss below the 50 EMA indicator or recent low.
- For sell trades, position the stop loss above the 50 EMA indicator or recent high.
- Maintain a technical exit level that protects your account from deep market retracements.
- Adjust the stop loss as the trend develops to lock in accrued profits safely.
Take Profit
- Set your target at the next significant resistance level or psychological price point.
- Consider exiting the trade if the 10 EMA crosses back over the 50 EMA indicator.
- Aim for a reward to risk ratio of at least two to one on every trade.
- Utilize a trailing stop that follows the slope of the 50 EMA indicator during trends.
3 EMAs Trend and Stochastic Divergence Forex Scalping Strategy for MT4
This MT4 scalping strategy combines the 3 EMAs Forex Indicator with the Stochastic Divergence Forex Indicator to create a trend‑filtered entry system with divergence confirmation.
The 3 EMAs indicator defines short‑term trend conditions by aligning the short, medium, and long EMAs in order.
The Stochastic Divergence indicator then provides precise entry signals through divergence arrows that appear on the chart, highlighting potential momentum shifts in the direction of the trend.
The idea behind this strategy is simple.
The 3 EMAs indicator helps you filter trades in the direction of the dominant scalping trend.
When the EMAs align for a buy trend, only bullish divergence signals are taken.
When they align for a sell trend, only bearish divergence signals are used.
This reduces countertrend entries and increases the probability of capturing quick price moves.
It works well on lower timeframes such as M1 and M5 and is suitable for major currency pairs with good volatility.
Buy Entry Rules
- The short EMA is above the medium EMA and the medium EMA is above the long EMA, indicating a buy trend.
- The Stochastic Divergence Forex Indicator prints a blue arrow (bullish divergence).
- Enter a buy trade at the close of the divergence signal candle.
- Place the stop loss a few pips below the recent swing low.
- Exit the trade when a red divergence arrow appears or when EMA alignment breaks.
Sell Entry Rules
- The short EMA is below the medium EMA and the medium EMA is below the long EMA, indicating a sell trend.
- The Stochastic Divergence Forex Indicator prints a red arrow (bearish divergence).
- Enter a sell trade at the close of the divergence signal candle.
- Place the stop loss a few pips above the recent swing high.
- Exit the trade when a blue divergence arrow appears or when EMA alignment breaks.
Advantages
- Trend filtering using 3 EMA alignment improves trade quality.
- Divergence signals help capture momentum shifts early in a scalping move.
- Works well on fast timeframes where quick exits are common.
- Easy to visualize trends and entry points on the chart.
- Reduces emotional trading by sticking to structured rules.
Drawbacks
- Divergence arrows can lag slightly after the price has already moved.
- During ranging markets, EMAs can provide mixed signals.
- Scalping requires tight spreads and fast execution.
- False divergences can trigger minor losing trades.
Case Study 1
On AUDUSD M1 during the London session, the short EMA sat clearly above the medium and long EMAs, signaling a strong buy trend.
After a minor pullback, the Stochastic Divergence Forex Indicator printed a blue arrow indicating bullish divergence.
A buy trade was entered at the close of the signal candle with a stop loss placed just below the recent swing low.
Price reacted quickly and moved higher.
The trade was exited when the next red divergence arrow appeared, capturing around 14 pips within minutes.
Case Study 2
On NZDUSD M5 during the early New York session, the EMAs aligned in a strong sell direction with the short below the medium and the medium below the long EMA.
The Stochastic Divergence Forex Indicator then produced a red arrow indicating bearish divergence.
A sell position was taken at candle close with a stop loss above the recent swing high.
Price accelerated downward shortly after entry and the trade was closed when the blue divergence arrow appeared, securing 29 pips.
Strategy Tips
- Trade only with clear EMA alignment to avoid sideways market noise.
- Wait for the divergence signal to fully form before entering.
- Use market sessions with higher liquidity for cleaner signals.
- Avoid trading near major news releases to reduce fake divergence triggers.
- Keep track of spread conditions to ensure scalping profitability.
- Practice consistent risk management for every trade.
- Review recent price action to understand how divergence behaves on your chart.
- Limit trades when EMA alignment shifts frequently without price follow‑through.
Download Now
Download the “price-emas.mq4” Metatrader 4 indicator
FAQ
How does the 200 EMA period improve the accuracy of these signals?
The 200 EMA serves as the ultimate filter for institutional direction.
By requiring the 10 and 50 EMAs to be on the correct side of this line, the 3 EMAs Indicator ensures you are not fighting against the primary market cycle.
Can I change the default periods to different values?
Yes, the 3 EMAs Indicator allows you to modify the settings in the inputs tab to match your style.
Some traders prefer faster settings like 5, 13, and 50 for quick intraday moves, while others stick to the 10, 50, and 200 defaults for long-term accuracy.
Testing different combinations is recommended to find what works for your specific assets.
Summary
The 3 EMAs Indicator is a powerful utility for traders who prioritize trend alignment and institutional momentum.
By breaking the market down into three distinct phases, it removes the guesswork from technical analysis and provides an objective way to manage risk.
Its primary benefit is its ability to keep you focused on high-probability setups where the short, medium, and long-term participants are all in agreement.
To get the most out of this system, always pair the signals with an understanding of basic support and resistance levels.


