About the Highest and Lowest Bar Price Indicator
The Highest and Lowest Bar Price indicator for MT5 highlights the extreme price points over a user-defined number of previous bars.
This makes it easy to see where the market has recently peaked or bottomed, providing key reference points for potential trades.
For example, entering 100 bars in the indicator’s settings will show the highest and lowest prices for the last 100 bars.
This allows you to quickly identify support and resistance levels or gauge breakout potential.
The indicator is simple, yet effective, and can be applied to any currency pair or trading instrument on MT5.
Free Download
iHighestiLowest.mq5 Indicator (MT5)
Key Features
- Displays the highest and lowest prices for a specified number of previous bars.
- Helps identify key support and resistance levels quickly.
- Simple and easy-to-read lines directly on the main chart.
- An adjustable number of bars to analyze past price extremes.
- Can assist in breakout, reversal, or range-bound trading strategies.
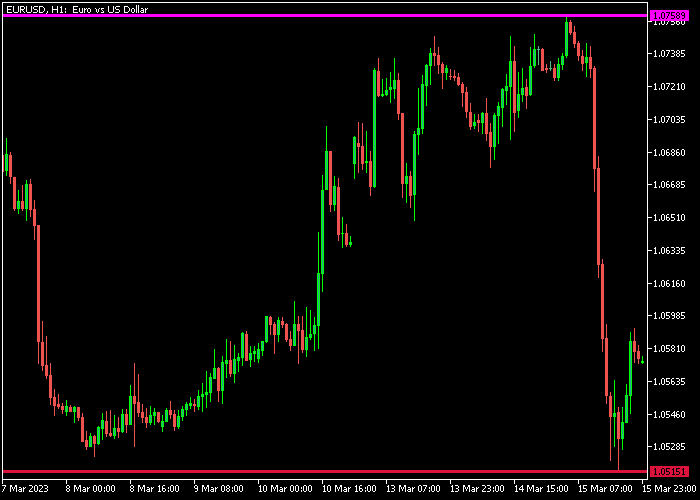
Indicator Chart
The indicator plots horizontal lines showing the highest and lowest prices over the selected number of bars.
Traders can use these lines as reference points for entry, exit, and risk management decisions, or to anticipate potential breakouts and pullbacks.

Guide to Trade with the Highest and Lowest Bar Price Indicator
Buy Rules
- Consider a buy when price approaches the lower bar line and shows signs of bouncing.
- Confirm that the overall trend or momentum supports a bullish move.
- Open a buy position when price begins to move upward from the low line.
- Use the line as a reference for potential entry confirmation rather than the sole signal.
Sell Rules
- Consider a sell when price approaches the upper bar line and shows signs of reversal.
- Ensure that downward pressure or trend aligns with a bearish move.
- Open a sell position when price starts moving downward from the high line.
- Use the line as a reference to validate timing and position size.
Stop Loss
- For buy trades, place the stop slightly below the lowest bar line.
- For sell trades, place the stop slightly above the highest bar line.
Take Profit
- For buy trades, consider taking profit near the previous swing highs or the upper bar line.
- For sell trades, target previous swing lows or the lower bar line.
- Partial exits can be made as price nears key levels.
- Alternatively, exit trades if price breaks the opposite extreme line signaling a reversal.
Download Now
iHighestiLowest.mq5 Indicator (MT5)
FAQ
How does the Highest and Lowest Bar Price indicator work?
It calculates and displays the extreme high and low prices over a user-defined number of previous bars, providing clear reference points for trading decisions.
Can I adjust the number of bars?
Yes. The indicator allows setting any number of previous bars to analyze, which determines how far back it looks for highs and lows.
How can it be used for entry and exit?
The high and low lines can be used as reference points to anticipate bounces, reversals, or breakouts, while stop loss and take profit levels can be placed near these extremes.
Summary
The Highest and Lowest Bar Price indicator provides a clear view of recent price extremes, helping identify support, resistance, and potential breakout areas.
With proper stop loss and take profit placement, it supports low-risk trading decisions across multiple timeframes.


