
About the Day Pivot Point Indicator
The Day Pivot Point indicator for MT5 calculates the daily pivot level together with multiple support and resistance levels.
These levels are plotted directly on the price area, allowing traders to quickly evaluate potential market turning points during the trading day.
Pivot points are widely used by forex traders to estimate intraday trend direction and potential price targets.
The central pivot level acts as a reference point that separates bullish and bearish market bias.
When price trades above the daily pivot point, the market is generally considered bullish.
When price trades below the pivot level, the market is typically considered bearish.
Traders often use this information to align their trades with the prevailing market direction.
The indicator automatically draws the pivot line together with multiple support and resistance levels.
These levels help traders identify potential entry areas, stop loss placement, and profit targets throughout the trading session.
Free Download
DayPivotPoint.mq5 Indicator (MT5)
Key Features
- Automatically calculates the daily pivot point.
- Displays multiple support and resistance levels.
- Plots pivot levels directly on the price area.
- Helps determine bullish or bearish market bias.
- Optional alerts and trade information display.
- Customizable colors, fonts, and line width settings.
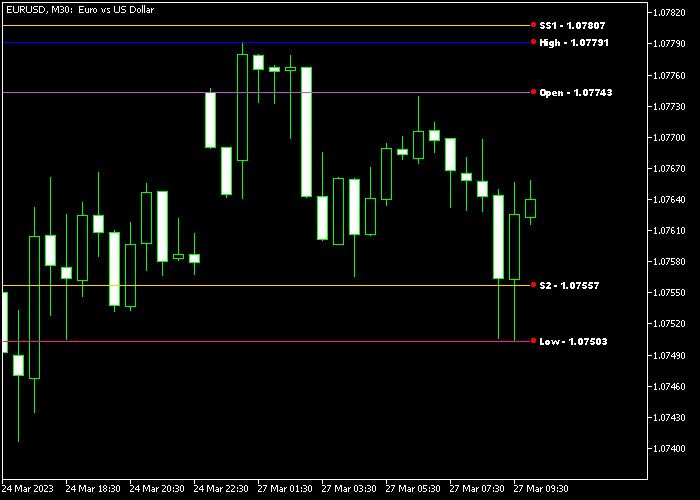
Indicator Chart
The Day Pivot Point indicator draws the central pivot level together with several support and resistance levels on the price area.
Traders observe how price reacts around these levels to identify potential buy and sell opportunities during the trading session.
Guide to Trade with the Day Pivot Point Indicator
Buy Rules
- Watch for the price to cross above the daily pivot point from below.
- This movement suggests that bullish momentum may start developing.
- Open a buy trade after the candle confirms the move above the pivot level.
- Ensure that the candle continues holding above the pivot area.
Sell Rules
- Wait for the price to cross below the daily pivot point from above.
- This move indicates that bearish pressure may begin building.
- Open a sell trade once the candle confirms the move below the pivot.
- Monitor price action to confirm downward momentum.
Stop Loss
- Place the stop loss about three pips below the previous swing low for buy trades.
- Place the stop loss about three pips above the previous swing high for sell trades.
Take Profit
- Close buy trades near resistance level 1, 2, or 3.
- Close sell trades near support level 1, 2, or 3.
- Use additional price action signals to refine exit decisions.
MT5 Day Pivot Point Indicator Scalping Strategy
This strategy combines the Day Pivot Point Forex Indicator with the Forex Trendy Indicator to build a clean and structured intraday trading method for the H1 timeframe.
The Day Pivot Point indicator defines market bias based on the pivot level. Price above the pivot is bullish and price below is bearish.
The Forex Trendy indicator confirms momentum direction using green arrows for bullish movement and magenta arrows for bearish movement.
This combination helps filter trades by requiring both structural bias and trend confirmation.
This strategy works best on H1 charts where daily levels are respected and intraday trends develop clearly.
Buy Entry Rules
- Confirm price is trading above the daily pivot point.
- Wait for a green arrow from the Forex Trendy indicator.
- Enter a buy trade after the signal candle closes.
- Place the stop loss below the pivot point or recent swing low.
- Close the buy trade when a magenta arrow appears from Forex Trendy or when price closes below the pivot point.
Sell Entry Rules
- Confirm price is trading below the daily pivot point.
- Wait for a magenta arrow from the Forex Trendy indicator.
- Enter a sell trade after the signal candle closes.
- Place the stop loss above the pivot point or recent swing high.
- Close the sell trade when a green arrow appears from Forex Trendy or when price closes above the pivot point.
Case Study 1: EURUSD H1 Buy Trade
On EURUSD H1, price moved above the daily pivot point, confirming a bullish trend for the session.
Shortly after, a green arrow appeared from the Forex Trendy indicator.
A buy trade was entered after the candle closed. The stop loss was placed below the pivot point.
Later that day, a magenta arrow appeared from the Forex Trendy indicator.
The buy trade was closed at that moment based on the opposite signal from Forex Trendy.
Case Study 2: GBPJPY H1 Sell Trade
On GBPJPY H1, price stayed below the daily pivot point, confirming bearish conditions.
After about 4 candles, a magenta arrow appeared from the Forex Trendy indicator.
A sell trade was entered after confirmation. The stop loss was placed above the pivot point.
1 day later, price closed back above the pivot point.
The short trade was closed at that point based on price crossing back above the Day Pivot Point indicator, signaling a shift in market direction.
Download Now
DayPivotPoint.mq5 Indicator (MT5)
FAQ
What is the purpose of the pivot point?
The pivot point acts as a central reference level for the trading day.
Traders use it to determine whether the market currently favors bullish or bearish conditions.
How are support and resistance levels calculated?
The support and resistance levels are calculated using the pivot point formula based on the previous day’s high, low, and closing prices.
Does the indicator provide alerts?
The indicator includes optional alert features that can notify traders when certain conditions occur depending on the settings.
Summary
The Day Pivot Point indicator helps traders identify important intraday price levels based on the previous trading session.
By plotting pivot levels together with support and resistance zones, it offers a practical framework for analyzing potential price movements.
Traders often use these levels to plan entries, exits, and profit targets throughout the trading day.
The central pivot level also provides a quick reference for determining overall market bias.
With automatic level calculation and customizable settings, the Day Pivot Point indicator offers a reliable way to integrate pivot analysis into daily trading routines.


