
About the Solar Winds Indicator
The Solar Winds Indicator for MT5 delivers straightforward buy and sell signals through a non-repainting color-coded histogram in a separate oscillator window.
Green bars signal bullish momentum for long entries. Red bars indicate bearish pressure for short opportunities.
Designed specifically for scalpers and day traders, it performs best during London and New York trading sessions when volume and volatility peak.
Customizable inputs include non-repainting mode, custom events, period length, smoothing factor, multiple alert types, and full color control.
Works across all MT5 forex pairs but excels on liquid majors during active market hours.
Free Download
Solar Winds.mq5 Indicator (MT5)
Key Features
- Non-repainting histogram prevents false historical signals.
- Optimized for London and American session scalping/day trading.
- Configurable period, smoothing, and multiple alert delivery methods.
- Custom events, email alerts, and on screen popup notifications available.
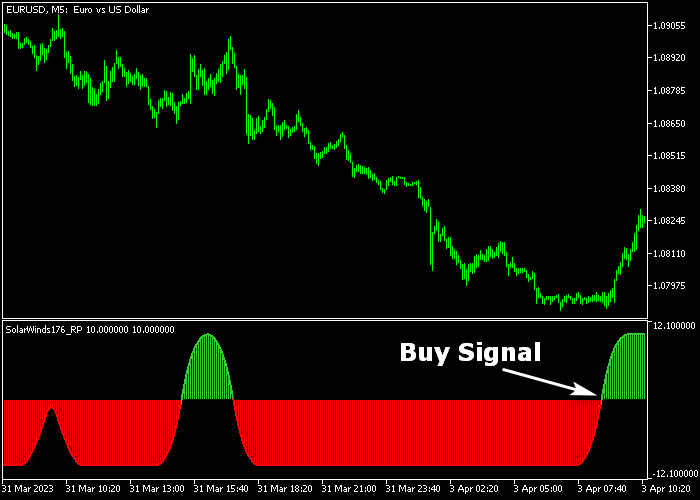
Indicator Chart
Solar Winds displays as a histogram below price action with green bars rising above zero for bullish momentum and red bars dropping below zero for bearish conditions.
Bar transitions from red to green or green to red mark the highest probability entry points.
During the London and New York sessions, you’ll see cleaner color changes with sustained bar direction. Asian session produces more frequent but less reliable flips.
Guide to Trade with the Solar Winds Indicator
Buy Rules
- Wait for histogram bars to turn green and start expanding above the zero line.
- Confirm price holds above the recent swing low during green bar formation.
- Enter buy on first or second green bar after the red-to-green transition.
Sell Rules
- Look for the histogram turning red with bars extending below the zero line.
- Verify price rejects recent swing high during sustained red expansion.
- Enter sell on the first or second red bar after the green-to-red color change.
Stop Loss
- Buy stops are placed below the most recent swing low before the green signal is formed.
- Sell stops set above the swing high preceding the red histogram confirmation.
- Risk maximum 1% account equity per trade regardless of stop distance.
Take Profit
- Scalpers target 0.5:1 to 1:1 risk reward on fast moves.
- Day traders aim for a 2:1 minimum or previous swing high/low levels.
- Scale out half position when the opposite color first appears near zero.
- Trail remaining stop to breakeven after 1:1 reward achieved.
Solar Winds Forex Indicator MT5 Scalping Strategy
This scalping strategy combines the Solar Winds Forex Indicator with the Super Arrow Buy Sell Indicator to capture short bursts of momentum in the market.
It focuses on fast entries where direction and timing align clearly, keeping decisions quick and precise.
The Solar Winds indicator displays market strength through histogram bars.
Green bars indicate bullish pressure, while red bars show bearish pressure. This gives a direct view of short-term direction.
The arrow indicator adds timing by marking potential reversal or continuation points with visual signals.
Blue arrows suggest buy opportunities, while red arrows indicate sell setups.
These arrows are designed to highlight moments where momentum shifts or continues.
This strategy is designed for M1 to M5 charts on active pairs.
Buy Entry Rules
- Wait for the Solar Winds histogram to turn green and remain bullish.
- Look for a blue arrow signal pointing upward.
- Enter a buy trade at the next candle open after the arrow appears.
- Place a stop loss just below the most recent minor pullback or consolidation area.
- Close the trade when the histogram starts fading or turns red, or when a red arrow appears.
Sell Entry Rules
- Wait for the Solar Winds histogram to turn red and remain bearish.
- Look for a red arrow signal pointing downward.
- Enter a sell trade at the next candle open after the arrow appears.
- Set the stop loss just above the most recent minor pullback or consolidation area.
- Close the trade when the histogram starts fading or turns green, or when a blue arrow appears.
Case Study 1
On the EURUSD M1 timeframe, the Solar Winds histogram turned green, indicating bullish momentum.
Shortly after, a blue arrow appeared below the price.
A buy trade was entered at the next candle open. The stop loss was placed below a recent pullback low.
Price moved upward in a quick move.
About fifteen minutes later, the histogram turned red and the trade was closed.
Case Study 2
On the GBPUSD M5 timeframe, the Solar Winds histogram turned red, indicating bearish momentum.
Shortly after, a red arrow appeared above the price.
A sell trade was entered at the next candle open. The stop loss was placed above a recent pullback high.
Price moved lower steadily.
Around twenty minutes later, the histogram turned green and the trade was closed.
Download Now
Solar Winds.mq5 Indicator (MT5)
FAQ
Does the Solar Winds indicator really never repaint signals?
Yes, this version locks signals once each bar completes. Historical green/red bars match exactly what you saw live.
What are the best forex pairs for Solar Winds scalping?
EURUSD, GBPUSD, and USDJPY deliver the cleanest signals during London/NY sessions.
GBPJPY and EURJPY work well for experienced scalpers accepting higher volatility. Avoid exotic pairs with wide spreads.
Should I adjust the default period and smoothing settings?
The default settings are optimized for M15 forex majors. Scalpers reduce the period to 8-12 for faster signals.
Day traders increase smoothing to 3-5 for cleaner direction.
Summary
The Solar Winds Indicator stands out with its non-repainting histogram that delivers clear green buy and red sell signals optimized for active trading sessions.
Perfectly suited for London and New York scalping, it locks each signal permanently for reliable backtesting that matches live performance.
Multiple alert options keep traders informed across devices while customizable smoothing adapts to different market conditions and trading styles.


