
About the Volume Profile + Range V 6.0 Indicator
The Volume Profile + Range V 6.0 Indicator for MT5 shows exactly where trading volume is concentrated at different price levels within your chosen time range.
Instead of time-based volume bars at the bottom, it plots horizontal volume histograms directly on your main price chart.
Longer bars reveal where the most trading activity occurred, marking natural support and resistance zones.
Thick volume areas act as magnets that price tends to return to, while thin volume zones often break easily.
With multiple calculation modes and customizable settings, you control exactly what period and data type to analyze.
Works with both tick volume and real volume data when your broker provides it.
Free Download
VP-Range-v6.mq5 Indicator (MT5)
Key Features
- Horizontal volume histograms plotted directly on main price chart.
- Shows VWAP, median, and maximum volume levels as reference lines.
- Configurable step size and point scale for precise level granularity.
- Supports both tick volume and real volume data sources.
Indicator Chart
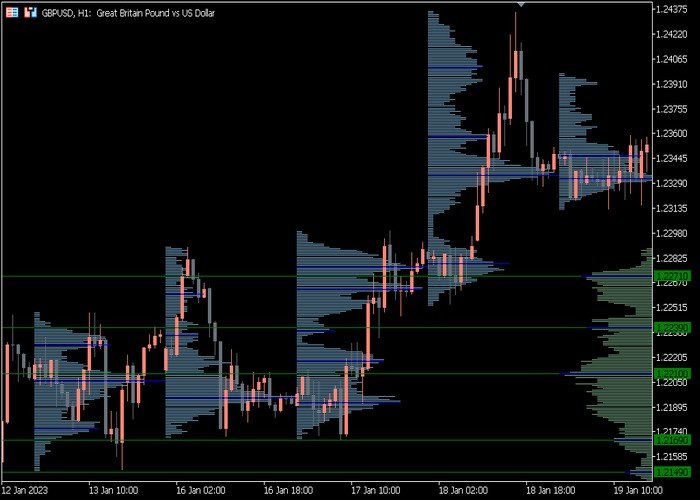
The Volume Profile + Range V 6.0 indicator displays horizontal volume bars extending from key price levels on your main chart.
The longest bars mark the highest volume nodes where most trading occurred.
Thinner areas show low volume zones that price moves through quickly.
Guide to Trade with the Volume Profile + Range V 6.0 Indicator
Buy Rules
- Look for price holding above high volume nodes acting as dynamic support.
- Enter longs from thick volume areas after bullish rejection patterns form.
- Confirm entries when price bounces from VWAP or median line support.
Sell Rules
- Target shorts from high volume resistance zones where price rejects sharply.
- Enter sells when price fails to break above thick volume ceiling levels.
- Look for bearish patterns forming right at VWAP or median line resistance.
Stop Loss
- For buy trades, place stops just below nearest high volume node support.
- For sell trades, set stops above the high volume resistance you are trading.
- Use thin volume zones beyond main levels for additional breathing room.
Take Profit
- First target is the next high volume node in profit direction.
- Scale out half position when price reaches VWAP of target zone.
- Trail stops to low volume gaps as price moves through thin areas.
- Exit fully at next major high volume zone or strong rejection pattern.
Download Now
VP-Range-v6.mq5 Indicator (MT5)
FAQ
What range mode works best for day trading?
Range Mode 1 using last 240-480 minutes captures the London or New York session volume perfectly.
This shows intraday volume distribution for precise support and resistance levels during active trading hours.
Should I use tick volume or real volume with this indicator?
Use real volume when your broker provides it for institutional-level accuracy.
Tick volume works fine as a directional proxy for most retail forex trading.
How do I identify the strongest support and resistance levels?
Longest horizontal volume bars mark the highest volume nodes and strongest support/resistance.
VWAP crossing multiple thick bars shows institutional interest levels.
Summary
The Volume Profile + Range V 6.0 Indicator reveals where real trading activity is concentrated by plotting horizontal volume histograms on your price chart.
High volume nodes become natural support and resistance that price respects repeatedly.
Multiple range modes let you analyze sessions, breakouts, or custom periods with VWAP and median reference lines.
Works with tick or real volume across all forex pairs and timeframes. Essential for understanding institutional price levels.


