
About the Wave MTF Indicator
The Wave MTF Indicator for MT5 is a multi-timeframe trend dashboard that shows the most profitable trend direction across nine timeframes in a single panel.
It appears in the upper right corner of your main chart and gives an instant overview from the one minute chart up to the monthly chart.
This helps you align every trade with the dominant market direction.
Each timeframe is represented by a simple circle.
A green circle signals a bullish trend on that timeframe, while a red circle indicates a bearish trend.
When most or all circles are the same color, you are looking at a strong, unified trend environment that favors trading in that direction.
You can adjust the starting and ending timeframes used for calculation, enable alerts, emails and push notifications, and modify the colors and arrow settings to match your chart style.
Free Download
Key Features
- Multi-timeframe trend dashboard covering up to nine timeframes in one view.
- Strong trends highlighted when most circles line up in one color either green or red.
- Optional on-screen alerts, email alerts and push notifications for new signals.
- Configurable display options including trade info, colors and arrow colors.
Indicator Chart
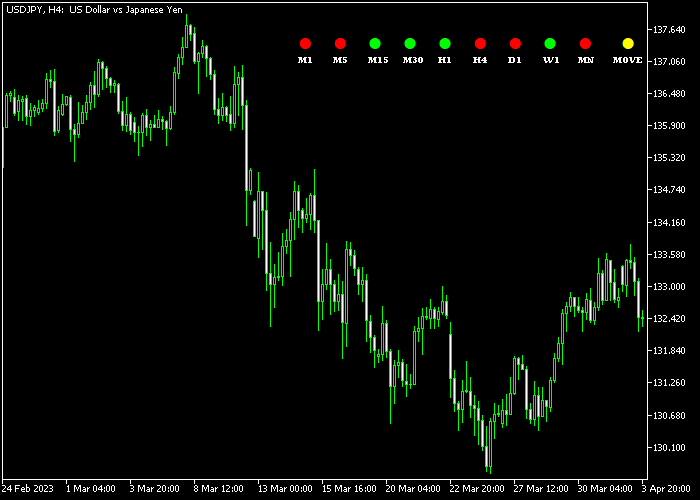
The Wave MTF Indicator displays a compact dashboard in the upper right corner of your chart.
Each row represents a timeframe from M1 up to MN, with colored circles showing whether bulls or bears are in control.
Green circles line up during bullish cycles, while red circles dominate in bearish phases.
When you see mixed colors, the market is likely choppy or transitioning between trends.
Guide to Trade with the Wave MTF Indicator
Buy Rules
- Look for a majority of green circles on your chosen working timeframe and higher timeframes.
- Prefer entries when at least three or more key timeframes (for example H1, H4 and D1) are green.
- Open a buy trade when price respects nearby support while the dashboard stays predominantly green.
- Avoid buying when the panel shows mixed colors or new red circles forming on higher timeframes.
Sell Rules
- Wait for a majority of red circles on your working timeframe and higher timeframes.
- Focus on shorts when important timeframes such as H1, H4 and D1 all display red circles.
- Open a sell trade when price rejects resistance while the dashboard remains strongly red.
- Skip new short trades if green circles start appearing on higher timeframes, hinting at a shift.
Stop Loss
- For buy trades, place the stop loss below the most recent support zone on your entry timeframe.
- For sell trades, set the stop loss above the latest resistance zone protecting your trade idea.
- Size each position so that your stop risk remains within your predefined account risk limit.
Take Profit
- Set initial targets near prior key resistance for buys and prior key support for sells.
- Consider trailing stops as long as the majority of circles stay in your trade direction.
- Take partial profits when colors start to mix, signaling a possible loss of trend strength.
- Close remaining positions when an opposite color majority forms, indicating a possible reversal.
Double Wave MTF Indicator Trading Strategy for MT5
This strategy combines the Wave MTF indicator with the AMA Wave indicator to create a trend-following approach with clear entry timing.
The Wave MTF indicator shows market direction across multiple timeframes using colored circles.
When most circles are green, it reflects bullish trend alignment across timeframes.
When most circles are red, it indicates bearish pressure.
The AMA Wave indicator adapts to market conditions and filters noise, making it useful for identifying clean entry points.
A sea-green AMA Wave signals a buy opportunity, while a pink AMA Wave signals a sell opportunity.
This combination allows traders to follow the overall trend while entering trades with precision.
The strategy works best on M5 and M15 charts and performs well on pairs like EURUSD, GBPJPY, and EURAUD.
Buy Entry Rules
- Wait for the majority of Wave MTF circles to turn green indicating bullish trend alignment.
- Look for the AMA Wave to turn sea-green.
- Enter a buy trade at the opening of the next candle after confirmation.
- Place stop loss below the most recent swing low or recent support level.
- Close the trade when the AMA Wave turns pink or when the Wave MTF circles begin shifting to red.
Sell Entry Rules
- Wait for the majority of Wave MTF circles to turn red indicating bearish trend alignment.
- Look for the AMA Wave to turn pink.
- Enter a sell trade at the opening of the next candle after confirmation.
- Place stop loss above the most recent swing high or recent resistance level.
- Close the trade when the AMA Wave turns sea-green or when the Wave MTF circles begin shifting to green.
Case Study 1
On the EURAUD M15 timeframe, the Wave MTF indicator showed a majority of green circles, confirming bullish conditions across multiple timeframes.
Shortly after, the AMA Wave turned sea-green, signaling a buy opportunity.
A buy trade was entered at the next candle open.
Price moved upward steadily with strong momentum.
About 2 hours later, the AMA Wave shifted to pink, indicating weakening bullish pressure, and the trade was closed.
Case Study 2
On the GBPJPY M5 timeframe, the Wave MTF indicator displayed mostly red circles, confirming bearish alignment.
Shortly after, the AMA Wave turned pink, signaling a sell opportunity.
A sell trade was entered at the next candle open.
Price moved lower with consistent momentum.
Around 35 minutes later, the AMA Wave changed to sea-green color, and the short trade was closed.
Download Now
FAQ
How many timeframes does the Wave MTF Indicator monitor?
The Wave MTF dashboard can monitor up to nine timeframes simultaneously, from the one minute chart to the monthly chart.
What does it mean when all circles are green or red?
When most or all circles are green, the market is in a strong bullish phase across multiple timeframes.
When most or all circles are red, sellers dominate and the market is in a decisive bearish trend.
How should I combine the Wave MTF Indicator with other tools?
Use the Wave MTF dashboard as a higher timeframe filter to confirm trend direction.
Then combine it with price action, support and resistance or moving averages on your entry timeframe.
Summary
The Wave MTF Indicator provides a compact and effective way to scan nine timeframes for bullish or bearish trends at a glance.
Green and red circles show where buyers or sellers dominate, helping you stay aligned with the broader market direction instead of trading blindly against it.
With flexible timeframe settings, alerts and customizable colors, the dashboard adapts to both intraday and swing trading approaches.
Use it as a trend filter together with solid trade entries and risk management to improve timing and avoid low probability counter trend setups.


