About the Bears Bulls Power Indicator
The Bears Bulls Power Indicator for MT5 visualizes the constant battle between buyers and sellers through a clear histogram in a separate window.
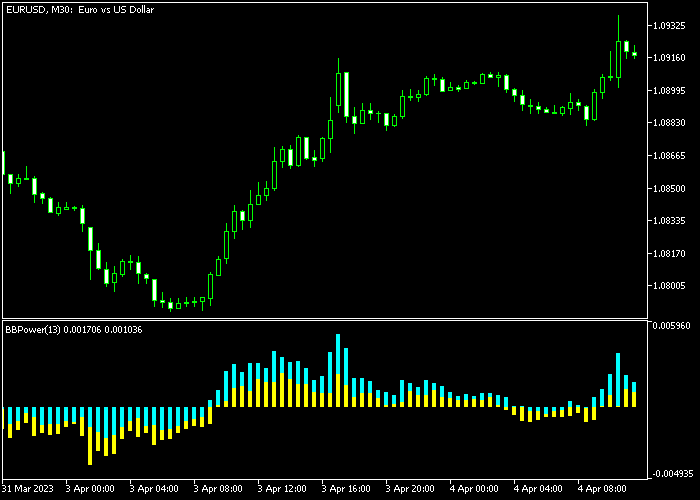
Blue bars show when bulls dominate above the zero line, while yellow bars indicate bears controlling the market below zero.
This simple yet powerful tool helps traders gauge momentum shifts before price fully reacts.
The indicator calculates the difference between price extremes and a moving average over a configurable period, typically 13.
When bulls push highs above the average, blue bars grow. When bears drive lows below it, yellow bars expand.
The only settings to adjust are the power period and bar colors, keeping the setup simple while delivering actionable insights into market sentiment.
Free Download
BearsBullsPower.mq5 Indicator (MT5)
Key Features
- Histogram shows bull (blue) vs bear (yellow) strength above/below zero line.
- Simple period setting (default 13) measures momentum between highs/lows and average.
- Zero line acts as dynamic equilibrium point between bulls and bears.
Indicator Chart
The Bears Bulls Power Indicator displays as colored histogram bars in a sub-window below price action.
Blue bars rising above zero show bulls gaining control, pushing price higher.
Yellow bars dropping below zero confirm bears dominating with downward price pressure.
Crosses through zero provide the clearest entry signals when momentum clearly shifts from one side to the other.

Guide to Trade with the Bears Bulls Power Indicator
Buy Rules
- Wait for blue bull bars to cross above the zero line with increasing height.
- Confirm price holds above recent swing lows during blue bar expansion.
- Enter buy trades when bars continue growing after the zero line breakout.
Sell Rules
- Look for yellow bear bars crossing below zero with bars getting deeper.
- Verify price rejects recent swing highs during sustained yellow expansion.
- Enter sell trades after bear bars confirm below zero with no bullish recovery.
Stop Loss
- For buy trades, place a stop 3 pips below the nearest short-term support level.
- For sell trades, set the stop 3 pips above immediate resistance zone.
- On volatile pairs, consider a 5-8 pip buffer from the histogram zero line cross.
Take Profit
- Target previous swing highs for buy trades or swing lows for sell trades.
- Take partial profits when opposite color bars first appear near zero.
- Exit completely when the histogram crosses zero against your position.
Bears Bulls Power MT5 Strategy for London and US Sessions
This strategy combines the Bears Bulls Power indicator with the ATR Adaptive T3 indicator to trade active market hours during the London and US sessions.
It focuses on clear directional bias with precise entry timing during periods of higher volatility.
The ATR Adaptive T3 indicator defines the trend.
A green line indicates bullish conditions while a magenta line indicates bearish conditions.
This sets the overall direction for trades during the session.
The Bears Bulls Power indicator provides entry signals using its histogram.
A bar crossing above zero signals a buy setup while a bar crossing below zero signals a sell setup.
These crossings are used as the trigger for entering trades.
Trades are taken only when both indicators align during London or US session hours, when price movement is more active and signals are more reliable.
Buy Entry Rules
- Wait for the ATR Adaptive T3 line to turn green.
- Enter a buy trade when the Bears Bulls Power histogram crosses above zero.
- Ensure price is positioned above the ATR Adaptive T3 line.
- Place the stop loss below the nearest support level or below the ATR line.
- Close the trade when the histogram crosses back below zero or when the ATR line turns magenta.
Sell Entry Rules
- Wait for the ATR Adaptive T3 line to turn magenta.
- Enter a sell trade when the Bears Bulls Power histogram crosses below zero.
- Ensure price is positioned below the ATR Adaptive T3 line.
- Place the stop loss above the nearest resistance level or above the ATR line.
- Close the trade when the histogram crosses back above zero or when the ATR line turns green.
Case Study 1: EURUSD M5 London Session Buy Trade
During the London session on EURUSD M5, the ATR Adaptive T3 line turned green, showing bullish direction.
Price moved above the line and held steady.
The Bears Bulls Power histogram then crossed above zero, confirming a buy setup.
A buy trade was opened after the crossover. The stop loss was placed below a recent support level.
The trade remained active while the histogram stayed above zero.
The long position was closed when the Bears Bulls histogram crossed back below zero.
Case Study 2: GBPUSD M5 US Session Sell Trade
During the US session on GBPUSD M5, the ATR Adaptive T3 line turned magenta, indicating bearish direction.
Price stayed below the line. The Bears Bulls Power histogram crossed below zero, confirming a sell setup.
A sell trade was entered after the signal. The stop loss was placed above a recent resistance level.
The trade remained active while the histogram stayed below zero.
The short position was closed when the Bears Bulls histogram crossed back above zero.
Download Now
BearsBullsPower.mq5 Indicator (MT5)
FAQ
What period setting works best for Bears Bulls Power?
Default 13-period balances sensitivity and reliability across most timeframes.
Scalpers use 8-10 for faster signals. Swing traders prefer 21 for smoother readings.
Should I wait for zero line crosses or trade early bar changes?
Zero line crosses provide the highest probability setups with confirmation. Early bar color changes work for aggressive scalping but increase false signals.
Conservative traders wait for zero cross plus price action confirmation.
Summary
The Bears Bulls Power Indicator delivers crystal clear bull vs bear momentum through colored histogram bars.
Blue above zero means buy pressure dominates. Yellow below zero shows bears in control. Simple setup with powerful market sentiment insights.
Zero line crosses provide high-probability entries while bar height shows momentum strength.
Perfect companion for price action traders seeking momentum confirmation.


