About the RSI Swings Indicator
The RSI Swings Indicator for MT5 identifies potential swing trading opportunities using the Relative Strength Index (RSI).
It displays colored histogram bars in a bottom chart, signaling bullish and bearish momentum for traders to act on.
Green histogram bars indicate bullish swings, while red bars signal bearish swings.
This visual representation allows traders to quickly interpret market trends and identify potential entries and exits.
Traders can combine the signals with price action, support/resistance levels, or other indicators to enhance accuracy and timing.
Customizable inputs include RSI period, average period, average method, applied price, level up, level down, and risk multiplier settings.
Free Download
Rsi swings.mq5 Indicator (MT5)
Key Features
- Displays colored histogram bars below the main chart to indicate market swings.
- Customizable RSI period, average period, and calculation method.
- Adjustable levels to define overbought and oversold conditions.
- Risk multiplier settings for position management and sensitivity.
- Helps traders visually track trend shifts and potential reversal points.
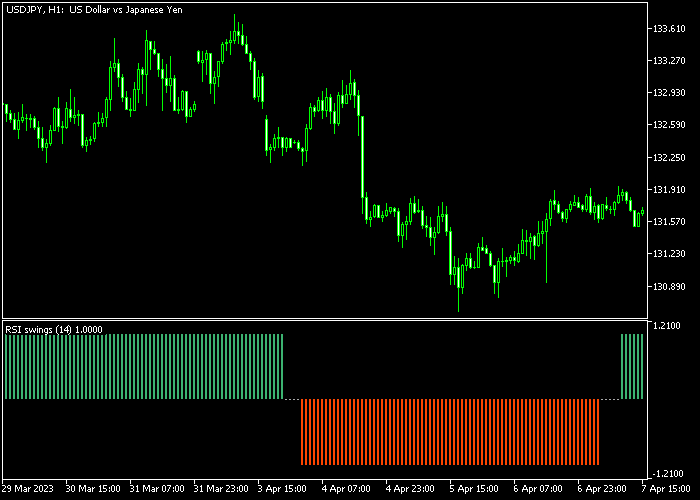
Indicator Chart
The RSI Swings Indicator displays green and red histogram bars in a separate bottom chart.
Traders look for the first green bar after a bearish trend as a potential buy signal, and the first red bar after a bullish trend as a potential sell signal.
The histogram provides a clear visual of RSI-based momentum changes.

Guide to Trade with RSI Swings Indicator
Buy Rules
- Wait for the first green histogram bar to appear after a bearish phase.
- Recognize this bar as a bullish swing signal.
- Open a buy trade when the green bar is confirmed.
- Monitor subsequent bars to manage the trade and confirm trend continuation.
Sell Rules
- Wait for the first red histogram bar to appear after a bullish phase.
- Recognize this bar as a bearish swing signal.
- Open a sell trade when the red bar is confirmed.
- Monitor subsequent bars to manage the trade and confirm downward momentum.
Stop Loss
- For buy trades, place the stop loss just below the most recent support area.
- For sell trades, place the stop loss just above the most recent resistance area.
Take Profit
- Set a fixed take profit target or exit based on subsequent histogram signals.
- Close buy trades when the first red bar appears.
- Close sell trades when the first green bar appears.
RSI Swings Confirmation with RSI Bollinger Bands Forex Strategy for MT5
This strategy combines the RSI Swings indicator with the RSI Bollinger Bands indicator.
It is designed to catch clean breakout moves from consolidation zones using momentum strength and trend confirmation.
The RSI Swings indicator shows market direction in a simple way.
A green histogram means bullish pressure, while a red histogram shows bearish pressure.
The RSI Bollinger Bands indicator is displayed in a separate window and gives entry signals using arrows.
A green arrow is a buy signal, while a red arrow is a sell signal.
This strategy works best on M15 and M30 timeframes.
It is useful during active trading sessions when breakouts often follow short consolidation phases.
Buy Entry Rules
- Wait for the RSI Swings histogram to turn green, showing bullish momentum.
- Confirm that a green arrow appears in the RSI Bollinger Bands window.
- Enter a buy trade at the close of the candle where both signals align.
- Place the stop loss below the most recent swing low or below the breakout zone.
- Take profit when the RSI Swings histogram turns red or when a red arrow appears in the RSI Bollinger Bands window.
- An alternative is to close at the next resistance level.
Sell Entry Rules
- Wait for the RSI Swings histogram to turn red, showing bearish momentum.
- Confirm that a red arrow appears in the RSI Bollinger Bands window.
- Enter a sell trade at the close of the candle where both signals align.
- Place the stop loss above the most recent swing high or above the breakout zone.
- Take profit when the RSI Swings histogram turns green or when a green arrow appears in the RSI Bollinger Bands window.
- An alternative is to close at the next support level.
Case Study 1: EURUSD M15 Buy Trade
On EURUSD M15, price moved sideways before breaking upward from a tight range.
The RSI Swings histogram turned green, showing growing bullish momentum.
Shortly after, a green arrow appeared in the RSI Bollinger Bands window, confirming the buy signal.
A buy trade was entered at the close of the candle and the stop loss was placed below the recent swing low.
3 hours later, the long trade was closed for 32 pips when the RSI Swings histogram turned red, confirming an opposite signal and signaling the exit.
Case Study 2: GBPUSD M30 Sell Trade
On GBPUSD M30, price failed to continue upward after a small consolidation.
The RSI Swings histogram turned red, showing bearish pressure.
A red arrow appeared in the RSI Bollinger Bands window at the same time, confirming the sell setup.
A sell trade was entered at the close of the candle and the stop loss was placed above the recent swing high.
5 hours later, the short trade was exited when a green arrow appeared in the RSI Bollinger Bands window, confirming an opposite signal and ending the trade.
Download Now
Rsi swings.mq5 Indicator (MT5)
FAQ
How do the histogram bars work?
Green bars indicate bullish swings, and red bars indicate bearish swings.
The bars reflect RSI momentum and help traders spot potential entries and exits.
Is it suitable for all trading styles?
Yes, the indicator is effective for scalping, day trading, and swing trading, offering visual signals for momentum changes.
Summary
The RSI Swings Indicator helps traders identify bullish and bearish momentum shifts using colored histogram bars.
By watching the first green or red bar after a trend shift, traders can enter trades with well-defined stop loss and take profit levels.
This makes the indicator practical for traders of all experience levels.
Adjustable parameters allow traders to fine-tune sensitivity and risk management, making it effective across scalping, intraday, and swing trading strategies on any MT5 instrument.


