
About the RSI Slope Divergence Indicator
The RSI Slope Divergence for MT5 is a trend-following indicator that combines a linear regression channel with an RSI slope divergence channel.
It is designed to help traders buy on dips and sell on rallies within established trends.
The linear regression channel identifies the overall market direction.
An upward-sloping channel signals a bullish trend, while a downward slope suggests bearish conditions.
The RSI slope divergence channel then provides precise timing for trade entries, helping traders spot temporary price retracements or rallies within the trend.
This two-part system reduces the guesswork in trend trading.
By waiting for the RSI to align with the channel, traders can enter positions closer to optimal levels, potentially improving risk management and trade efficiency.
The indicator allows customization of RSI period, price type, linear regression period, channel width, and visual settings such as colors and style.
Free Download
Rsi slope divergence.mq5 Indicator (MT5)
Key Features
- Combines RSI slope divergence with a linear regression channel for trend-based entries.
- Identifies dips in bullish trends and rallies in bearish trends.
- Provides visual guidance for timing entries within trending markets.
- Customizable parameters including RSI period and regression channel width.
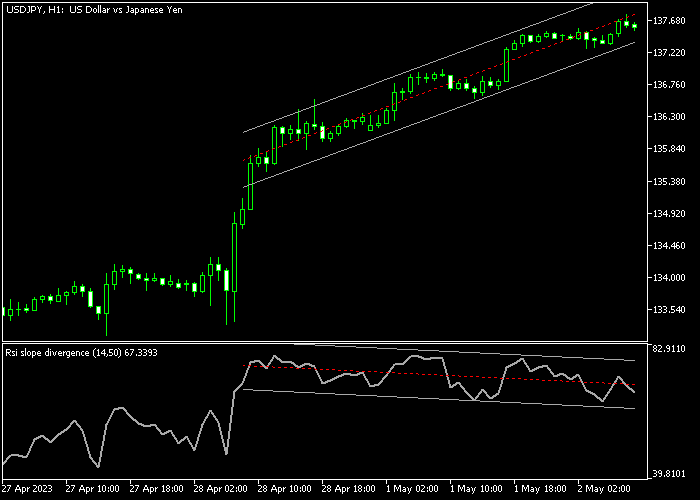
Indicator Chart
The RSI Slope Divergence indicator appears on the main price area with the regression channel overlaid on the price chart, while the RSI slope divergence channel is displayed below as a separate signal line.
Traders observe the slope of the regression channel to identify trend direction and monitor the RSI’s interaction with its channel to determine potential entries during temporary market dips or rallies.
Guide to Trade with RSI Slope Divergence Indicator
Buy Rules
- Ensure the linear regression channel is sloping upwards, signaling a bullish trend.
- Wait for the RSI to touch the lower boundary of its channel.
- Confirm that price is near the lower portion of the regression channel for added alignment.
- Enter a long position once the RSI reaction indicates a potential rebound.
Sell Rules
- Ensure the linear regression channel is sloping downwards, signaling a bearish trend.
- Wait for the RSI to touch the upper boundary of its channel.
- Confirm that price is near the upper portion of the regression channel for alignment.
- Enter a short position once the RSI reaction indicates a potential decline.
Stop Loss
- Set protective levels beyond recent swing points to guard against adverse moves.
- Adjust dynamically based on volatility and timeframe.
- Consider wider placement in fast-moving markets to avoid premature exits.
Take Profit
- Set targets based on the next significant support or resistance level.
- Partial position closure can be used to secure profits during strong trends.
- Alternatively, apply a risk-to-reward ratio suitable for your strategy.
- Adjust targets if market conditions change rapidly or a trend accelerates.
MT5 RSI Slope Divergence Indicator Day Trading Strategy
This day trading strategy combines the RSI Slope Divergence Indicator with the CCI Breakout Histogram Indicator to create a clear trend and momentum-based trading system.
The RSI Slope Divergence indicator uses a regression channel to show the direction of the market.
When the channel slopes upward, it reflects bullish momentum. When it slopes downward, it signals bearish pressure.
This type of analysis helps traders align with the dominant trend and avoid trading against momentum.
The CCI Breakout Histogram indicator provides entry signals based on momentum strength.
A blue bar above zero shows bullish momentum, while a pink bar below zero signals bearish pressure.
This strategy works best on M5, M15, and H1 timeframes and is ideal for intraday traders who want to follow trends and enter trades with confirmation.
Buy Entry Rules
- Confirm that the RSI Slope Divergence channel is sloping upward, indicating a bullish trend.
- Wait for a blue histogram bar from the CCI Breakout Histogram above the zero level.
- Enter a buy trade at the close of the signal candle.
- Place a stop loss below the recent swing low or below the lower boundary of the channel.
- Close the trade when a pink histogram bar appears or when the channel starts sloping downward.
Sell Entry Rules
- Confirm that the RSI Slope Divergence channel is sloping downward, indicating a bearish trend.
- Wait for a pink histogram bar from the CCI Breakout Histogram below the zero level.
- Enter a sell trade at the close of the signal candle.
- Place a stop loss above the recent swing high or above the upper boundary of the channel.
- Close the trade when a blue histogram bar appears or when the channel starts sloping upward.
Case Study 1: EURUSD M15 London Session Buy Trade
On EURUSD M15 during the London session, the RSI Slope Divergence channel was clearly sloping upward, confirming a bullish trend.
After a small pullback, a blue histogram bar appeared above the zero level on the CCI Breakout Histogram.
A buy trade was opened at the close of the signal candle.
The stop loss was placed below the recent swing low, just under the lower boundary of the channel.
The trade was closed when a pink histogram bar appeared, indicating that bullish momentum was fading and the upward move was ending.
Case Study 2: USDJPY H1 New York Session Sell Trade
On USDJPY H1 during the New York session, the RSI Slope Divergence channel was sloping downward, confirming bearish conditions.
A pink histogram bar appeared below the zero line during a minor retracement, signaling a sell entry.
A sell trade was opened at the close of the signal candle.
The stop loss was placed above a recent swing high near the upper boundary of the channel.
The trade was closed when a blue histogram bar appeared and the channel began to flatten, showing that selling pressure was weakening and a reversal could begin.
Download Now
Rsi slope divergence.mq5 Indicator (MT5)
FAQ
How does this indicator improve entry timing?
By combining trend slope from the regression channel with RSI divergence, it identifies points where price temporarily retraces within a trend, giving traders a more precise entry opportunity.
Which settings can be customized?
Traders can adjust the RSI period, regression channel width, linear regression period, price type, and visual style to match their preferred timeframe and trading strategy.
Is it suitable for all markets?
Yes. The RSI Slope Divergence indicator can be applied to any instrument supported by MetaTrader 5, including Forex, commodities, indices, and cryptocurrencies.
Can it be used for short-term trading?
Yes. It works on all timeframes, making it suitable for intraday dip-and-rally trades as well as longer-term swing setups.
Summary
The RSI Slope Divergence indicator is a dual-channel system that merges trend direction with momentum timing.
Traders can use it to buy dips in uptrends and sell rallies in downtrends, improving trade precision.
Its combination of regression channel slope and RSI divergence offers a structured approach to trading within trends while helping avoid entering against the dominant market movement.
Customizable inputs, adaptable timeframes, and compatibility with any MT5 instrument make this indicator flexible for a variety of trading styles.


