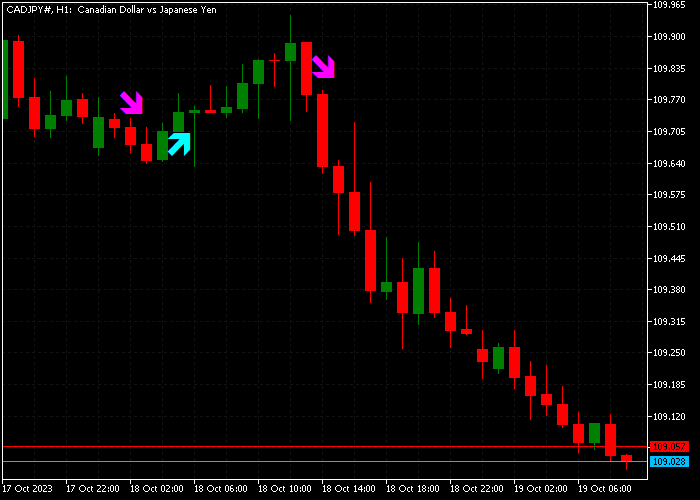
About the Averages Trend Composite Indicator
The Averages Trend Composite Indicator for MT5 converts price action into a signals oscillator based on exponential moving averages (EMA).
It appears in a separate chart window and oscillates above and below the zero level, providing a clear view of short-term market trends.
Green EMA bars indicate bullish momentum, while violet bars signal bearish momentum.
This indicator works well as a standalone scalping tool or as a supplementary trend confirmation tool alongside other strategies.
Key parameters such as averages period, method, applied price, and smoothing can be adjusted to fit specific market conditions and instruments, allowing flexibility for both intraday scalpers and swing traders.
Free Download
Averages composite trend.mq5 Indicator (MT5)
Key Features
- Transforms price data into a signals oscillator using EMA.
- Adjustable EMA period, method, applied price, and smoothing.
- Helps detect short-term entry and exit opportunities for scalping.
- Supports both trend confirmation and standalone trading strategies.
Indicator Chart
The Averages Trend Composite Indicator appears below the main price chart as a colored EMA oscillator.
Green bars show up when bullish momentum is building, while violet bars appear when bearish pressure increases.
The oscillator provides a simple trading setup to spot potential trade entries and exits with quick recognition of trend shifts.

Guide to Trade with Averages Trend Composite Indicator
Buy Rules
- Wait until a green EMA bar appears above the zero line, signaling bullish momentum.
- Confirm that the trend is stable and not a short-term spike.
- Enter a long trade once the green bar persists for at least one additional bar.
- Optionally, check nearby support levels to strengthen the trade setup.
Sell Rules
- Look for the first violet EMA bar below the zero line, indicating bearish pressure.
- Ensure that the downward movement shows follow-through on the next bar.
- Enter a short trade after confirming trend continuity.
- Consider resistance zones or other indicators to validate the signal.
Stop Loss
- For buy trades, place the stop a few pips below the most recent short-term swing low or support area.
- For sell trades, place the stop a few pips above the recent swing high or resistance level.
- Maintain stops in line with your overall risk management strategy.
Take Profit
- Close buy trades when the EMA oscillator reverses to violet.
- Close sell trades when the EMA oscillator reverses to green.
- Traders can also trail stops along the oscillator to capture extended trends.
MT5 Averages Composite Trend Indicator Scalping Strategy
This scalping strategy combines the Averages Composite Trend Indicator with the Dark Inversion Indicator to capture quick intraday moves on M1 and M5 charts.
The Averages Composite Trend indicator builds a trend view using multiple moving averages, helping traders clearly identify direction and momentum strength.
When green EMA bars appear above the zero line, it signals a strong bullish trend. When violet bars appear below the zero line, it confirms bearish pressure.
The Dark Inversion indicator provides precise entry timing. A green arrow signals a buy opportunity, while a red arrow signals a sell opportunity.
This combination allows traders to follow the trend while entering at optimal moments.
This strategy is designed for fast scalping with a target of 8 to 20 pips per trade.
It works best during active sessions such as London and New York where volatility is high.
Buy Entry Rules
- Confirm that the Averages Composite Trend bars are green and positioned above the zero line.
- Wait for a green arrow from the Dark Inversion indicator.
- Enter a buy trade at the close of the signal candle.
- Place the stop loss below the most recent swing low.
- Set a take profit target between 8 and 20 pips, depending on market volatility.
- Close the trade early if violet bars appear below the zero line or a red arrow forms.
Sell Entry Rules
- Confirm that the Averages Composite Trend bars are violet and positioned below the zero line.
- Wait for a red arrow from the Dark Inversion indicator.
- Enter a sell trade at the close of the signal candle.
- Place the stop loss above the most recent swing high.
- Set a take profit target between 8 and 20 pips, depending on market conditions.
- Close the trade early if green bars appear above the zero line or a green arrow forms.
Case Study 1: EURUSD M1 London Session Buy Trade
On EURUSD M1 during the London session, the Averages Composite Trend indicator showed strong green bars above the zero line, confirming a bullish trend.
A green arrow appeared from the Dark Inversion indicator after a small pullback. A buy trade was opened at the close of the signal candle.
The stop loss was placed below the recent swing low to protect against sudden reversals.
The long trade was closed when a red arrow appeared, indicating a potential bearish short-term trend reversal.
Case Study 2: GBPUSD M5 New York Session Sell Trade
On GBPUSD M5 during the New York session, the Averages Composite Trend indicator showed violet bars below the zero line, confirming a bearish trend.
A red arrow appeared from the Dark Inversion indicator, signaling a sell entry. A sell trade was opened at the close of the signal candle.
The stop loss was placed above the recent swing high to allow room for minor retracements.
The short trade was closed after a green arrow appeared, showing that bearish momentum was fading and a reversal could begin.
Download Now
Averages composite trend.mq5 Indicator (MT5)
FAQ
What makes the Averages Trend Composite different from other EMA tools?
Unlike a standard EMA, this indicator converts price action into a colored oscillator that oscillates around zero, making it easier to spot short-term trend shifts and potential trade opportunities.
Can it be used for scalping and longer trades?
Yes. On lower timeframes, it works well for scalping small moves, while on higher timeframes it can confirm larger trend directions as part of a swing trading strategy.
Is it suitable for beginners?
Yes. The oscillator’s clear green and violet bars provide straightforward visual signals, making it easy for beginners to identify buy and sell conditions without complex analysis.
Summary
The Averages Trend Composite Indicator simplifies trend identification by transforming EMA data into a clear colored oscillator.
Green bars indicate bullish conditions, while violet bars signal bearish momentum, allowing traders to quickly spot potential entries and exits.
With adjustable settings for period, method, and smoothing, it can be tailored to any currency pair and timeframe.
This makes it a flexible tool for scalpers and swing traders alike, whether used alone or combined with other indicators for added confirmation.