About the MACD Squeeze Indicator
The MACD Squeeze indicator for MT5 combines momentum and volatility analysis to help traders identify strong trading opportunities.
It uses a combination of Bollinger Bands, the Keltner Channel, and exponential moving averages to detect squeeze conditions and momentum shifts.
The indicator appears as a colored oscillator that moves above and below the zero level.
When the value moves above zero, the market shows bullish momentum. When the value drops below zero, the market shows bearish momentum.
This approach allows traders to quickly evaluate trend direction while also identifying moments when volatility expands after a squeeze.
The indicator also includes several adjustable parameters such as MACD periods, Bollinger Bands settings, and Keltner Channel values.
These options allow traders to adapt the indicator to different trading styles and timeframes.
Free Download
MACD_Squeeze.mq5 Indicator (MT5)
Key Features
- Combines Bollinger Bands and Keltner Channel calculations.
- Uses MACD exponential moving averages for momentum analysis.
- Identifies volatility squeeze conditions in the market.
- Provides buy and sell signals based on zero level crossovers.
- Fully customizable MACD, Bollinger Bands, and Keltner settings.
- Performs strongly during active trading sessions.
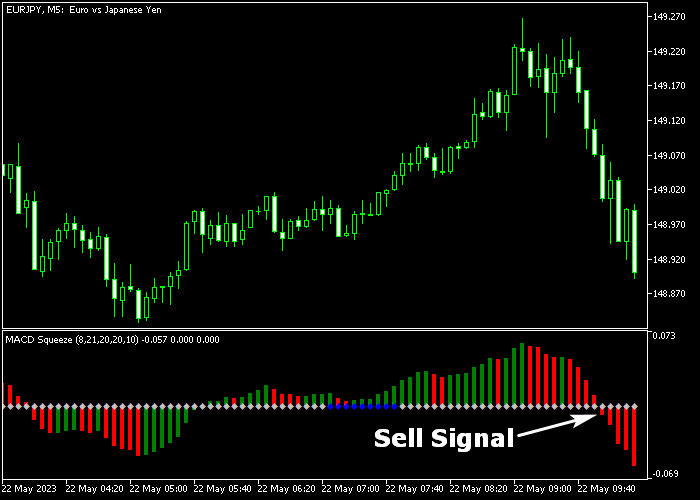
Indicator Chart
The MACD Squeeze Indicator appears beneath the main price area as a colored oscillator that moves above and below the zero level.
Green bars indicate bullish momentum while red bars indicate bearish momentum.
Traders use these color changes and zero level movements to identify potential buy and sell opportunities.

Guide to Trade with MACD Squeeze Indicator
Buy Rules
- Wait for the MACD Squeeze oscillator to turn green and move back above the zero level.
- This movement indicates that bullish momentum is starting to build.
- Open a buy position once the indicator confirms the move above zero.
- Trading during the London or New York session can improve signal reliability on lower timeframes.
Sell Rules
- Wait for the MACD Squeeze oscillator to turn red and move back below the zero level.
- This indicates that bearish momentum is entering the market.
- Open a sell position once the indicator confirms the move below zero.
- Signals tend to perform best during active market sessions.
Stop Loss
- Place the stop loss below the nearest technical support level for buy trades.
- For sell trades, place the stop loss above the nearest resistance level.
Take Profit
- Close the position when the oscillator produces an opposite signal.
- Many traders also use a fixed risk-to-reward ratio such as 1:2.
- Positions can also be closed near important support or resistance levels.
MACD Squeeze Day Trading Forex Strategy for MT5
This strategy combines the MACD Squeeze Indicator with the Bounce Zone Forex Indicator to create a focused day trading approach.
It uses momentum from the oscillator together with clear price reaction zones to manage exits.
The MACD Squeeze Indicator provides momentum signals through histogram bars around the zero line.
When the histogram moves above zero, it signals bullish pressure, and below zero it signals bearish pressure.
The Bounce Zone Indicator highlights key support and resistance areas where price is likely to react or reverse.
This combination allows traders to enter based on momentum and exit at logical price zones.
It works best during active trading hours on M5 and M15 charts, especially for intraday setups.
Buy Entry Rules
- Wait for a green MACD Squeeze bar to appear above the zero line.
- Ensure price is moving upward with clear momentum.
- Enter a buy trade at the close of the signal candle.
- Place stop loss below the most recent intraday low.
- Close the trade when price reaches the red resistance bounce zone.
Sell Entry Rules
- Wait for a red MACD Squeeze bar to appear below the zero line.
- Confirm that price is moving downward with momentum.
- Enter a sell trade at the close of the signal candle.
- Place stop loss above the most recent intraday high.
- Close the trade when price reaches the green support bounce zone.
Case Study 1: Momentum Buy with Resistance Target
On EURGBP M5, the MACD Squeeze printed a green bar above the zero line after a short consolidation.
This indicated a shift toward bullish momentum.
A buy trade was opened at the close of the signal candle.
The stop loss was placed below the recent swing low.
Price moved upward steadily toward a visible resistance area highlighted by the Bounce Zone Indicator.
The long trade was closed when price reached the red resistance bounce zone.
Case Study 2: Momentum Sell with Support Target
On NZDUSD M15, the MACD Squeeze printed a red bar below the zero line, signaling bearish momentum.
Price started to move downward with increasing pressure.
A sell trade was opened at candle close. The stop loss was placed above the recent high.
Price continued declining toward a support area identified by the Bounce Zone Indicator.
The short trade was closed when price reached the green support bounce zone.
Download Now
MACD_Squeeze.mq5 Indicator (MT5)
FAQ
What does the MACD Squeeze Indicator measure?
The indicator measures momentum and volatility using a combination of MACD, Bollinger Bands, and the Keltner Channel.
This combination helps detect squeeze conditions and momentum shifts.
Which timeframes work best with this indicator?
The indicator works on all timeframes. Many traders prefer using it on M1 and M5 charts during the London and New York trading sessions.
Can the indicator settings be customized?
Yes. Traders can adjust MACD fast and slow EMA periods, Bollinger Bands settings, and Keltner Channel parameters to match their trading strategy.
Summary
The MACD Squeeze indicator combines volatility and momentum analysis into one practical trading tool.
It highlights potential market moves using a colored oscillator that reflects bullish or bearish pressure.
The integration of Bollinger Bands, Keltner Channel calculations, and MACD momentum helps traders identify squeeze conditions and trend direction simultaneously.
With flexible settings and straightforward signals, the indicator offers a useful method for traders who want to track momentum changes and volatility expansion in the Forex market.


