
About the Trailing Stop Level Indicator
The Trailing Stop Level indicator for MT5 converts price volatility into a dynamic trend-following tool that provides timely buy and sell signals.
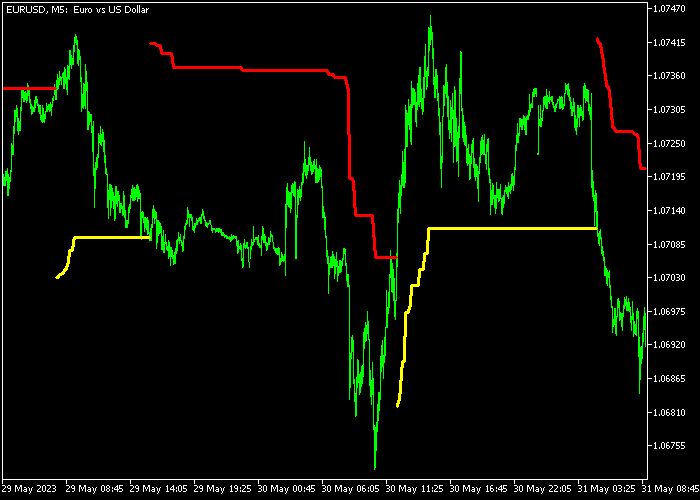
Displayed as a dual-colored line on the price chart, it shows yellow for bullish trends and red for bearish trends.
This technical tool is highly customizable, allowing adjustment of the percent parameter and line style.
Its adaptive design ensures a faster response to price changes, making it ideal for traders seeking precise entry and exit points on short or medium-term timeframes.
Free Download
Trailing_Stop_Level.mq5 Indicator (MT5)
Key Features
- Calculates optimal exit points based on percentage-based price fluctuations.
- Provides real-time trend identification through intuitive yellow and red color shifts.
- Functions as both a trend-following entry signal and a risk management tool.
- Allows traders to lock in profits automatically by trailing stops behind price action.
Indicator Chart
The chart displays the Trailing Stop Level indicator plotted as a continuous line that tracks price movement.
When the line is yellow and positioned below the candles, the market is in a bullish phase.
Conversely, a red line appearing above the candles confirms a bearish trend.
Traders can use these levels to set initial stop losses and adjust them as the trend develops.
Guide to Trade with Trailing Stop Level Indicator
Buy Rules
- A buy signal arises when the yellow trailing stop level line appears in the chart.
- Open a buy trade once the price successfully breaks and closes above the red line.
- Confirm that the line has shifted color to yellow to ensure bullish momentum.
- Maintain the position as long as the price remains above the yellow trailing line.
Sell Rules
- A sell signal arises when the red trailing stop level line appears in the chart.
- Open a sell trade immediately after the price closes below the yellow line.
- Look for the line to turn red to confirm that sellers have taken control.
- Keep the sell order active until the indicator shifts back to a bullish state.
Stop Loss
- Place your stop loss below the yellow line and trail up your stop loss.
- For sell orders, place the stop loss above the red line and trail it down.
- Continuously move the stop level to the current position of the indicator line.
Take Profit
- The buy or sell trade will be automatically closed when your trailing stop loss is hit.
- Alternatively, set a fixed profit target at a major technical resistance or support level.
- Liquidate the trade manually if the price shows a sharp rejection at a psychological level.
Trailing Stop Level MT5 Strategy with Trend Signals V2 Confirmation
This strategy combines the Trailing Stop Level Indicator with the Trend Signals V2 Indicator to create a structured day trading approach focused on trend following with dynamic exit management.
The Trend Signals V2 indicator provides clear directional bias.
A blue line signals a buy trend, while a red line signals a sell trend.
It helps traders identify when the market is actively moving in one direction and when it is not suitable for trading against the trend.
The Trailing Stop Level indicator is used only for trade management.
It plots a yellow trailing stop line for buy positions and a red trailing stop line for sell positions.
Instead of fixed take profit levels, trades are managed by following this trailing structure as price develops.
This strategy works well on M15 and H1 charts where trends are more stable and allow for smoother trailing stop progression.
Buy Entry Rules
- Wait for the Trend Signals V2 line to turn blue, confirming a bullish trend.
- Enter a buy trade at the close of the confirmation candle.
- Place the initial stop loss below the most recent swing low.
- Activate the trailing stop using the yellow Trailing Stop Level line once price moves in favor.
- Hold the trade as long as the Trend Signals V2 remains blue.
- Exit the trade when the Trend Signals V2 line turns red or when price closes below the trailing stop line.
Sell Entry Rules
- Wait for the Trend Signals V2 line to turn red, confirming a bearish trend.
- Enter a sell trade at the close of the confirmation candle.
- Place the initial stop loss above the most recent swing high.
- Activate the trailing stop using the red Trailing Stop Level line once price moves in favor.
- Hold the trade as long as the Trend Signals V2 remains red.
- Exit the trade when the Trend Signals V2 line turns blue or when price closes above the trailing stop line.
Case Study 1: Buy Trade Example (EUR/USD M15)
The Trend Signals V2 line turned blue, confirming a bullish intraday trend.
A buy trade was opened at the close of the signal candle.
The stop loss was placed below the most recent swing low.
As price moved upward, the trailing stop level indicator activated and the yellow line began following price from below.
The buy position was held while the trend remained blue and was exited automatically when price closed below the yellow trailing stop line, locking in the final movement of the bullish trend.
Case Study 2: Sell Trade Example (GBP/JPY H1)
The Trend Signals V2 line turned red, confirming bearish conditions.
A sell trade was opened at the close of the signal candle with the stop loss placed above the most recent swing high.
As price moved lower, the red trailing stop line followed price from above and guided trade management.
The short trade remained active while the trend stayed red and was exited when price closed above the trailing stop line.
Download Now
Trailing_Stop_Level.mq5 Indicator (MT5)
FAQ
How does the percent parameter affect the indicator signals?
The percent setting determines the sensitivity of the trailing level.
A higher percentage creates a wider gap, reducing noise during long trends, while a lower percentage makes the line more responsive for scalping.
Can I use this indicator as a standalone strategy?
While the indicator provides both entry and exit levels, it is most effective when combined with a volume oscillator.
This helps confirm that the trend shift has enough momentum to sustain a move.
Is this indicator suitable for volatile news events?
The indicator adapts to volatility, but during extreme news events, price gaps can occur.
It is best to use the trailing levels to lock in gains once the initial volatility has settled.
Summary
The Trailing Stop Level indicator provides a streamlined approach to technical analysis by merging trend detection with momentum filtering.
It allows traders to navigate different market conditions by visually separating bullish impulses from bearish pressure.
By automating the exit process through dynamic levels, it helps maintain discipline and protects capital during trending markets.


